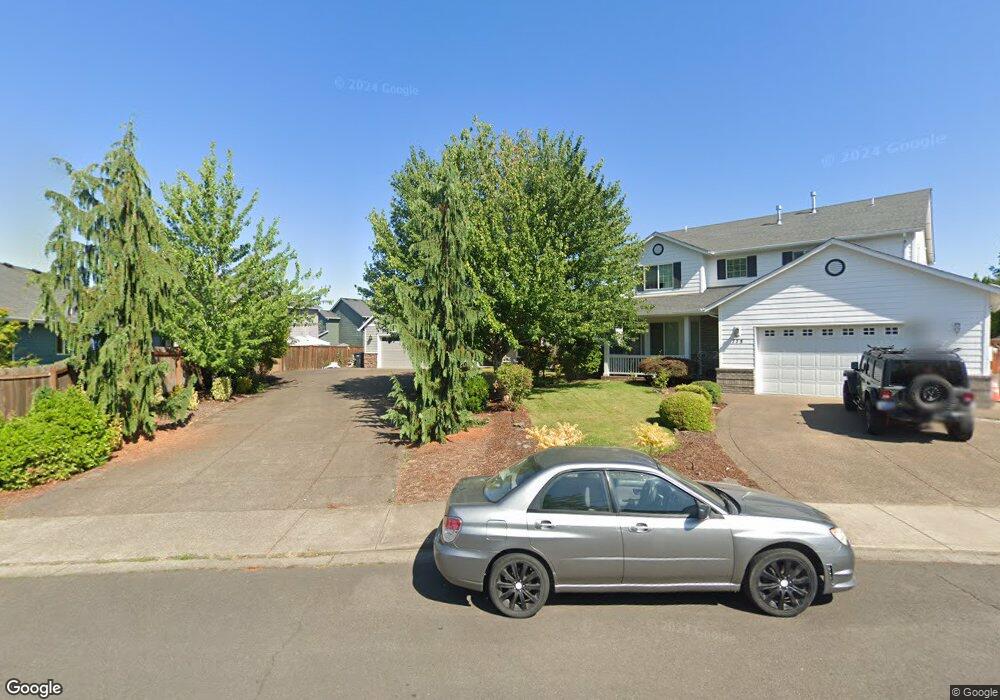
781 Kelsey Loop Molalla, OR 97038
Estimated Value: $515,000 - $558,000
4
Beds
2
Baths
2,020
Sq Ft
$264/Sq Ft
Est. Value
About This Home
This home is located at 781 Kelsey Loop, Molalla, OR 97038 and is currently estimated at $533,621, approximately $264 per square foot. 781 Kelsey Loop is a home located in Clackamas County with nearby schools including Oregon Outreach - Molalla Pride.
Ownership History
Date
Name
Owned For
Owner Type
Purchase Details
Closed on
Mar 2, 2011
Sold by
Future Construction & Homes Llc
Bought by
Engstrom Edward K and Engstrom Susan G
Current Estimated Value
Home Financials for this Owner
Home Financials are based on the most recent Mortgage that was taken out on this home.
Original Mortgage
$196,000
Outstanding Balance
$133,672
Interest Rate
4.71%
Mortgage Type
New Conventional
Estimated Equity
$399,949
Purchase Details
Closed on
Feb 16, 2011
Sold by
Tran Co
Bought by
Future Construction & Homes Llc
Home Financials for this Owner
Home Financials are based on the most recent Mortgage that was taken out on this home.
Original Mortgage
$196,000
Outstanding Balance
$133,672
Interest Rate
4.71%
Mortgage Type
New Conventional
Estimated Equity
$399,949
Purchase Details
Closed on
Oct 16, 2007
Sold by
Hilligoss Homes Inc
Bought by
Tran Co
Create a Home Valuation Report for This Property
The Home Valuation Report is an in-depth analysis detailing your home's value as well as a comparison with similar homes in the area
Purchase History
| Date | Buyer | Sale Price | Title Company |
|---|---|---|---|
| Engstrom Edward K | $245,000 | First Amer Title Ins Co Or | |
| Future Construction & Homes Llc | $85,900 | First Amer Title Ins Co Or | |
| Tran Co | $75,000 | None Available |
Source: Public Records
Mortgage History
| Date | Status | Borrower | Loan Amount |
|---|---|---|---|
| Open | Engstrom Edward K | $196,000 |
Source: Public Records
Tax History
| Year | Tax Paid | Tax Assessment Tax Assessment Total Assessment is a certain percentage of the fair market value that is determined by local assessors to be the total taxable value of land and additions on the property. | Land | Improvement |
|---|---|---|---|---|
| 2025 | $5,471 | $285,578 | -- | -- |
| 2024 | $5,288 | $277,261 | -- | -- |
| 2023 | $5,288 | $269,186 | $0 | $0 |
| 2022 | $4,360 | $261,346 | $0 | $0 |
| 2021 | $4,181 | $253,734 | $0 | $0 |
| 2020 | $4,065 | $246,344 | $0 | $0 |
| 2019 | $3,946 | $239,169 | $0 | $0 |
| 2018 | $3,836 | $232,203 | $0 | $0 |
| 2017 | $3,678 | $225,440 | $0 | $0 |
| 2016 | $3,487 | $218,874 | $0 | $0 |
Source: Public Records
Map
Nearby Homes
- 924 Julie Ln
- 633 June Dr
- 660 Village Dr Unit 13
- 686 Columbia Dr
- 829 Toliver Rd
- 871 Mary Dr
- 1200 Rachel Ln
- 1160 Rachel Ln
- 1141 Rachel Ln
- 1161 Rachel Ln
- 1181 Rachel Ln
- 1191 Rachel Ln
- 1201 Rachel Ln
- 1121 Rachel Ln
- 1241 Rachel Ln
- 505 Leroy Ave Unit J
- 505 Leroy Ave
- 940 Explorer Ave
- 1247 Boardwalk Ave
- 340 Doug Fir Ln
Your Personal Tour Guide
Ask me questions while you tour the home.