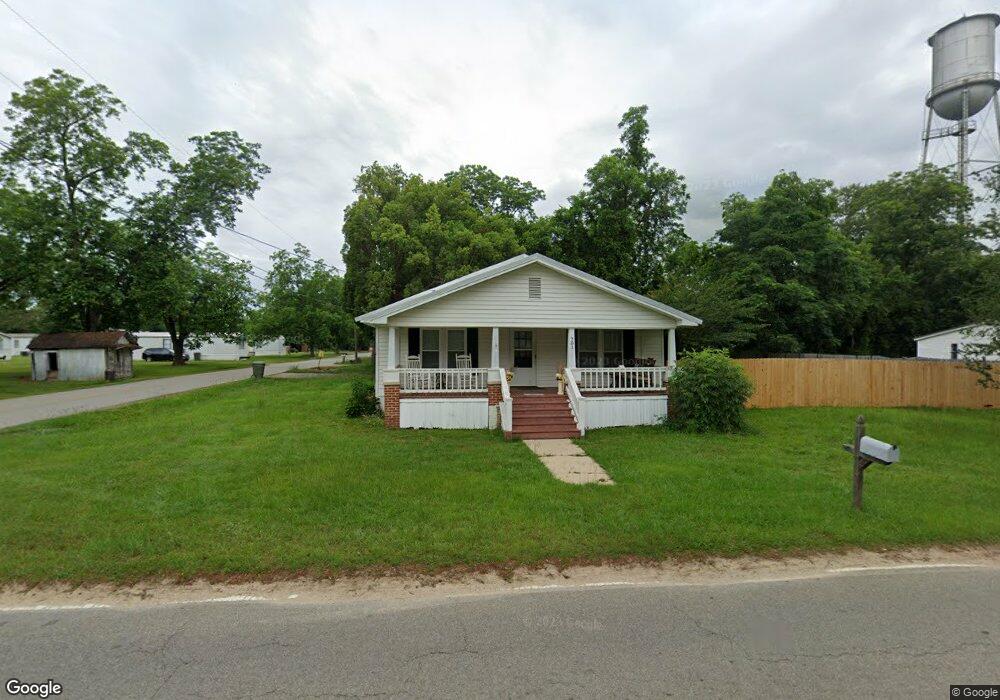
781 Main St Enigma, GA 31749
Estimated Value: $88,000 - $162,000
3
Beds
2
Baths
1,500
Sq Ft
$88/Sq Ft
Est. Value
About This Home
This home is located at 781 Main St, Enigma, GA 31749 and is currently estimated at $132,519, approximately $88 per square foot. 781 Main St is a home located in Berrien County with nearby schools including Berrien Primary School, Berrien Elementary School, and Berrien Middle School.
Ownership History
Date
Name
Owned For
Owner Type
Purchase Details
Closed on
Apr 23, 2010
Sold by
Suntrust Bank
Bought by
Hutchinson Sandra
Current Estimated Value
Purchase Details
Closed on
Aug 4, 2009
Sold by
Casselman Christopher
Bought by
Suntrust Bank
Purchase Details
Closed on
May 12, 2006
Sold by
Citifinancial Services Inc
Bought by
Casselman Christopher
Home Financials for this Owner
Home Financials are based on the most recent Mortgage that was taken out on this home.
Original Mortgage
$37,000
Interest Rate
6.41%
Mortgage Type
New Conventional
Purchase Details
Closed on
Nov 1, 2005
Sold by
Citifinancial Svcs Inc
Bought by
Citifinancial Svcs Inc
Purchase Details
Closed on
Sep 9, 2002
Sold by
Hanniford Joseph
Bought by
Collins John and Collins B
Purchase Details
Closed on
Nov 10, 1999
Sold by
Burch Anita Stovall
Bought by
Hanniford Joseph
Create a Home Valuation Report for This Property
The Home Valuation Report is an in-depth analysis detailing your home's value as well as a comparison with similar homes in the area
Home Values in the Area
Average Home Value in this Area
Purchase History
| Date | Buyer | Sale Price | Title Company |
|---|---|---|---|
| Hutchinson Sandra | $32,000 | -- | |
| Suntrust Bank | $41,700 | -- | |
| Suntrust Bank | $41,742 | -- | |
| Casselman Christopher | $37,000 | -- | |
| Citifinancial Svcs Inc | $46,900 | -- | |
| Collins John | $66,000 | -- | |
| Hanniford Joseph | $59,900 | -- |
Source: Public Records
Mortgage History
| Date | Status | Borrower | Loan Amount |
|---|---|---|---|
| Previous Owner | Casselman Christopher | $37,000 |
Source: Public Records
Tax History Compared to Growth
Tax History
| Year | Tax Paid | Tax Assessment Tax Assessment Total Assessment is a certain percentage of the fair market value that is determined by local assessors to be the total taxable value of land and additions on the property. | Land | Improvement |
|---|---|---|---|---|
| 2024 | $664 | $18,303 | $1,498 | $16,805 |
| 2023 | $667 | $18,303 | $1,498 | $16,805 |
| 2022 | $667 | $18,303 | $1,498 | $16,805 |
| 2021 | $671 | $18,303 | $1,498 | $16,805 |
| 2020 | $672 | $18,303 | $1,498 | $16,805 |
| 2019 | $672 | $18,303 | $1,498 | $16,805 |
| 2018 | $655 | $18,303 | $1,498 | $16,805 |
| 2017 | $672 | $18,303 | $1,498 | $16,805 |
| 2016 | $655 | $18,303 | $1,498 | $16,805 |
| 2015 | -- | $18,303 | $1,498 | $16,805 |
| 2014 | -- | $18,303 | $1,498 | $16,805 |
| 2013 | -- | $19,805 | $3,000 | $16,805 |
Source: Public Records
Map
Nearby Homes
- 2242 U S 82
- 395 Harris St
- 1922 Turner Church Rd
- 287 Brookfield Nashville Rd
- 204 Brookfield Nashville Rd
- 2264 Spurlock Rd
- 49 Quail Ln
- 339 Chapel Hill Cir Unit 15
- 339 Chapel Hill Cir
- 0 Quail Ln
- 21 Brookfield-Lenox Rd
- 3365 Chula Brookfield Rd
- 58 Honeysuckle Ln
- 0 Baker Rd
- 2635 Brookfield-Lenox Rd
- 69 Branch Ln
- 2066 U S 82
- . Alapaha River Dr
- 720 Vanceville County Line Rd
- 5 Paradise Lake Rd