781 Pine Ave Pacific Grove, CA 93950
Estimated Value: $1,451,361 - $1,701,000
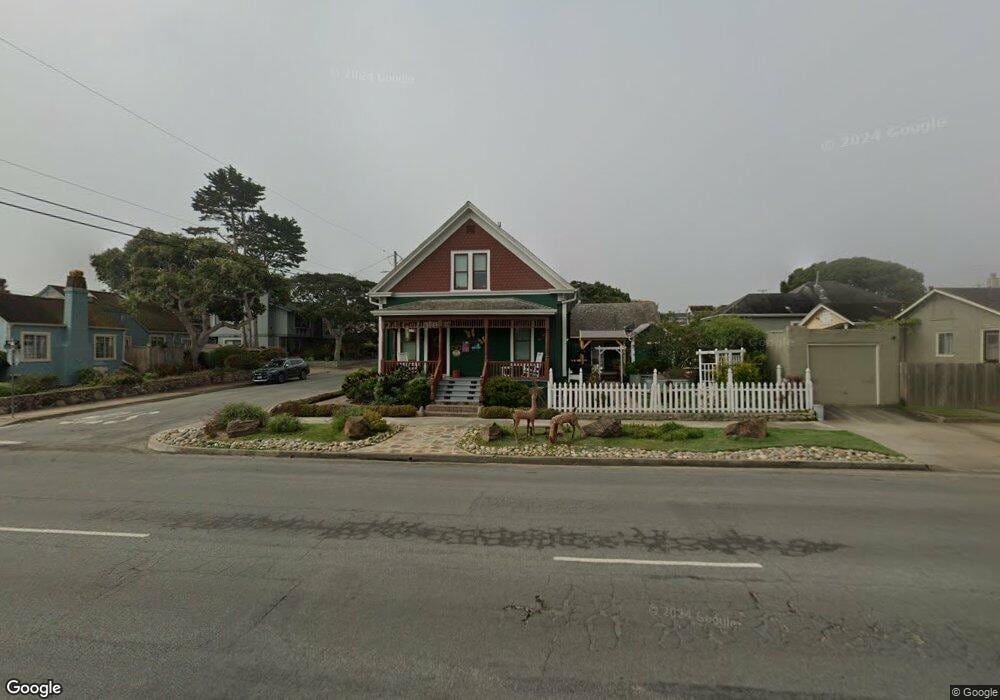
About This Home
This home is located at 781 Pine Ave, Pacific Grove, CA 93950 and is currently estimated at $1,560,340, approximately $811 per square foot. 781 Pine Ave is a home located in Monterey County with nearby schools including Robert Down Elementary School, Pacific Grove Middle School, and Pacific Grove High School.
Ownership History
We collect this data history from publicly available records. To have your information removed, we recommend requesting removal directly through your county’s website.
Purchase Details
Home Financials for this Owner
Home Financials are based on the most recent Mortgage that was taken out on this home.Home Values in the Area
Average Home Value in this Area
Purchase History
We collect this data history from publicly available records. To have your information removed, we recommend requesting removal directly through your county’s website.
| Date | Buyer | Sale Price | Title Company |
|---|---|---|---|
| -- | -- |
Mortgage History
We collect this data history from publicly available records. To have your information removed, we recommend requesting removal directly through your county’s website.
| Date | Status | Borrower | Loan Amount |
|---|---|---|---|
| Closed | $437,000 |
Tax History
We collect this data history from publicly available records. To have your information removed, we recommend requesting removal directly through your county’s website.
| Year | Tax Paid | Tax Assessment Tax Assessment Total Assessment is a certain percentage of the fair market value that is determined by local assessors to be the total taxable value of land and additions on the property. | Land | Improvement |
|---|---|---|---|---|
| 2025 | $676 | $60,959 | $26,758 | $34,201 |
| 2024 | $676 | $59,765 | $26,234 | $33,531 |
| 2023 | $736 | $58,594 | $25,720 | $32,874 |
| 2022 | $722 | $57,446 | $25,216 | $32,230 |
| 2021 | $718 | $56,321 | $24,722 | $31,599 |
| 2020 | $705 | $55,744 | $24,469 | $31,275 |
| 2019 | $685 | $54,652 | $23,990 | $30,662 |
| 2018 | $674 | $53,581 | $23,520 | $30,061 |
| 2017 | $664 | $52,531 | $23,059 | $29,472 |
| 2016 | $665 | $51,502 | $22,607 | $28,895 |
| 2015 | $655 | $50,729 | $22,268 | $28,461 |
| 2014 | $642 | $49,736 | $21,832 | $27,904 |
Map
- 310 Cypress Ave
- 851 Laurel Ave
- 801 Junipero Ave
- 219 Willow St
- 215 Lobos Ave
- 665 Pine Ave
- 631 Junipero Ave
- 195 Cedar St
- 418 Fountain Ave
- 841 Congress Ave
- 938 Lighthouse Ave
- 515 Fountain Ave
- 494 Grove Acre Ave
- 132 Forest Ave
- 520 Lighthouse Ave Unit 301
- 116 16th St
- 313 14th St
- 743 Marino Pines Rd
- 512 12th St
- 700 Briggs Ave Unit 77
Ask me questions while you tour the home.