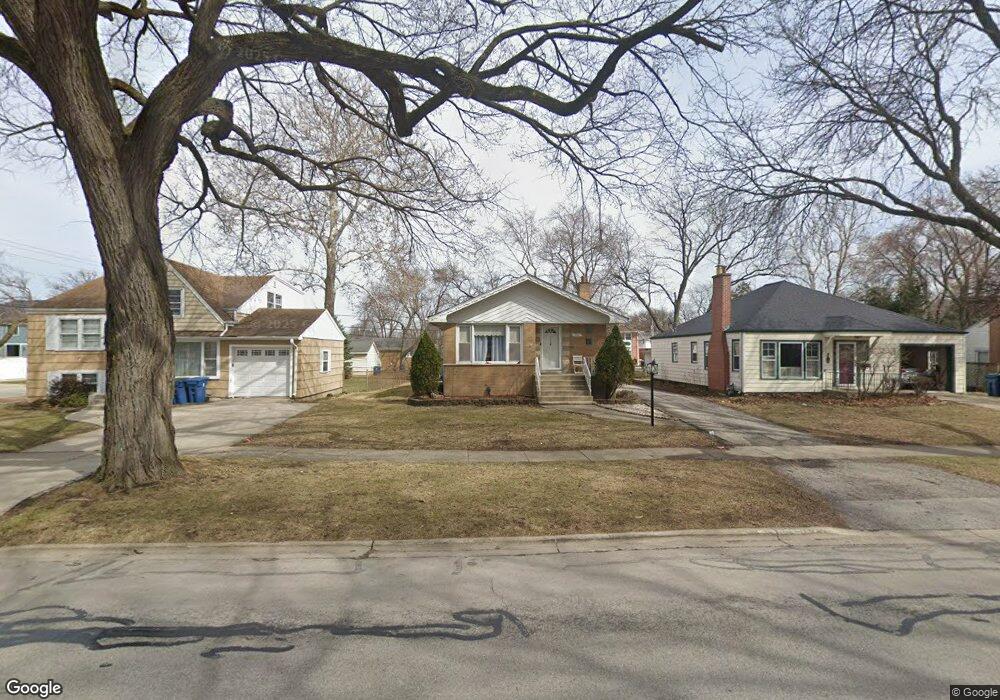
781 S Spring Rd Elmhurst, IL 60126
Estimated Value: $457,004 - $557,000
3
Beds
--
Bath
1,058
Sq Ft
$468/Sq Ft
Est. Value
About This Home
This home is located at 781 S Spring Rd, Elmhurst, IL 60126 and is currently estimated at $495,251, approximately $468 per square foot. 781 S Spring Rd is a home located in DuPage County with nearby schools including Jackson Elementary School, Bryan Middle School, and York Community High School.
Ownership History
Date
Name
Owned For
Owner Type
Purchase Details
Closed on
May 10, 2016
Sold by
Reedy Leo and Reedy Adeline
Bought by
L & A Reedy Family Limited Partnership
Current Estimated Value
Purchase Details
Closed on
Nov 13, 2015
Sold by
L & A Reedy Family Limited Partnership
Bought by
Reedy Leo and Reedy Adeline
Home Financials for this Owner
Home Financials are based on the most recent Mortgage that was taken out on this home.
Original Mortgage
$217,500
Outstanding Balance
$133,232
Interest Rate
4.25%
Mortgage Type
New Conventional
Estimated Equity
$362,019
Purchase Details
Closed on
Mar 21, 2006
Sold by
Trombino Robert and Davis Scharfhausen Marie
Bought by
Reedy Leo P
Home Financials for this Owner
Home Financials are based on the most recent Mortgage that was taken out on this home.
Original Mortgage
$260,000
Interest Rate
6.5%
Mortgage Type
Purchase Money Mortgage
Purchase Details
Closed on
Apr 2, 1999
Sold by
Bank One Trust Company Na
Bought by
Trombino William and Trombino Angeline T
Create a Home Valuation Report for This Property
The Home Valuation Report is an in-depth analysis detailing your home's value as well as a comparison with similar homes in the area
Home Values in the Area
Average Home Value in this Area
Purchase History
| Date | Buyer | Sale Price | Title Company |
|---|---|---|---|
| L & A Reedy Family Limited Partnership | -- | Attorney | |
| Reedy Leo | -- | Ravenswood Title Company Llc | |
| Reedy Leo P | $325,000 | Ctic | |
| Trombino William | -- | Collar Counties Title Plant |
Source: Public Records
Mortgage History
| Date | Status | Borrower | Loan Amount |
|---|---|---|---|
| Open | Reedy Leo | $217,500 | |
| Previous Owner | Reedy Leo P | $260,000 |
Source: Public Records
Tax History
| Year | Tax Paid | Tax Assessment Tax Assessment Total Assessment is a certain percentage of the fair market value that is determined by local assessors to be the total taxable value of land and additions on the property. | Land | Improvement |
|---|---|---|---|---|
| 2024 | $7,450 | $123,615 | $67,101 | $56,514 |
| 2023 | $6,940 | $114,310 | $62,050 | $52,260 |
| 2022 | $6,664 | $109,900 | $59,660 | $50,240 |
| 2021 | $6,505 | $107,170 | $58,180 | $48,990 |
| 2020 | $6,259 | $104,820 | $56,900 | $47,920 |
| 2019 | $6,139 | $99,660 | $54,100 | $45,560 |
| 2018 | $5,874 | $94,820 | $51,200 | $43,620 |
| 2017 | $5,757 | $90,360 | $48,790 | $41,570 |
| 2016 | $5,650 | $85,120 | $45,960 | $39,160 |
| 2015 | $5,613 | $79,300 | $42,820 | $36,480 |
| 2014 | $5,879 | $76,290 | $39,090 | $37,200 |
| 2013 | $5,811 | $77,360 | $39,640 | $37,720 |
Source: Public Records
Map
Nearby Homes
- 742 S Saylor Ave
- 745 S Hillside Ave
- 849 S Swain Ave
- 868 S Spring Rd
- 696 S Prospect Ave
- 688 S Mitchell Ave
- 769 S Fairview Ave
- 722 S Berkley Ave
- 663 S Hawthorne Ave
- 680 S Bryan St
- 634 S Spring Rd
- 878 S Parkside Ave
- 618 S Swain Ave
- 611 S Prospect Ave
- 936 S Mitchell Ave
- 956 S Hillside Ave
- 881 S Bryan St
- 594 S Fairfield Ave
- 101 W Jackson St
- 570 S Parkside Ave
- 787 S Spring Rd
- 791 S Spring Rd
- 782 S Saylor Ave
- 786 S Saylor Ave
- 790 S Saylor Ave
- 291 W Madison St
- 794 S Saylor Ave
- 776 S Spring Rd
- 780 S Spring Rd
- 281 W Madison St
- 784 S Spring Rd
- 765 S Spring Rd
- 798 S Saylor Ave
- 788 S Spring Rd
- 770 S Spring Rd
- 763 S Spring Rd
- 792 S Spring Rd
- 804 S Saylor Ave
- 796 S Spring Rd
- 760 S Saylor Ave
Your Personal Tour Guide
Ask me questions while you tour the home.