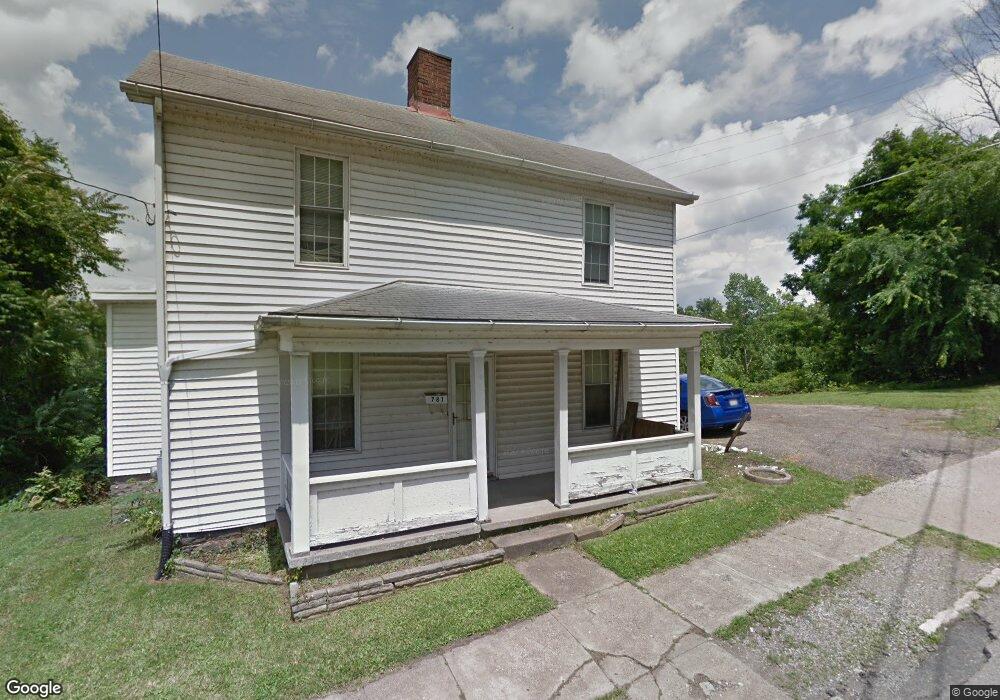
781 W Muskingum Ave Zanesville, OH 43701
Estimated Value: $61,000 - $124,000
3
Beds
1
Bath
1,485
Sq Ft
$58/Sq Ft
Est. Value
About This Home
This home is located at 781 W Muskingum Ave, Zanesville, OH 43701 and is currently estimated at $85,726, approximately $57 per square foot. 781 W Muskingum Ave is a home located in Muskingum County with nearby schools including Zane Grey Elementary School, Zanesville Middle School, and Zanesville High School.
Ownership History
Date
Name
Owned For
Owner Type
Purchase Details
Closed on
Apr 17, 2003
Sold by
Yurich Kevin and Yurich Susan
Bought by
Ommo Kathy J
Current Estimated Value
Home Financials for this Owner
Home Financials are based on the most recent Mortgage that was taken out on this home.
Original Mortgage
$53,200
Outstanding Balance
$22,871
Interest Rate
5.76%
Mortgage Type
Purchase Money Mortgage
Estimated Equity
$62,855
Purchase Details
Closed on
May 4, 2001
Sold by
Vandenberg Edward L
Bought by
Yurich Kevin and Yurich Susan
Purchase Details
Closed on
Feb 3, 1998
Sold by
West Rodger
Bought by
Edinger Robert L
Home Financials for this Owner
Home Financials are based on the most recent Mortgage that was taken out on this home.
Original Mortgage
$30,450
Interest Rate
7.16%
Mortgage Type
VA
Purchase Details
Closed on
Jun 16, 1995
Sold by
West Rodger W
Bought by
Kimball Helen
Create a Home Valuation Report for This Property
The Home Valuation Report is an in-depth analysis detailing your home's value as well as a comparison with similar homes in the area
Home Values in the Area
Average Home Value in this Area
Purchase History
| Date | Buyer | Sale Price | Title Company |
|---|---|---|---|
| Ommo Kathy J | $56,000 | -- | |
| Yurich Kevin | $15,000 | -- | |
| Edinger Robert L | $29,900 | -- | |
| Kimball Helen | $32,500 | -- |
Source: Public Records
Mortgage History
| Date | Status | Borrower | Loan Amount |
|---|---|---|---|
| Open | Ommo Kathy J | $53,200 | |
| Previous Owner | Edinger Robert L | $30,450 | |
| Closed | Kimball Helen | $0 |
Source: Public Records
Tax History Compared to Growth
Tax History
| Year | Tax Paid | Tax Assessment Tax Assessment Total Assessment is a certain percentage of the fair market value that is determined by local assessors to be the total taxable value of land and additions on the property. | Land | Improvement |
|---|---|---|---|---|
| 2024 | $927 | $24,815 | $3,535 | $21,280 |
| 2023 | $476 | $11,900 | $2,030 | $9,870 |
| 2022 | $457 | $11,900 | $2,030 | $9,870 |
| 2021 | $453 | $11,900 | $2,030 | $9,870 |
| 2020 | $404 | $10,325 | $1,750 | $8,575 |
| 2019 | $404 | $10,325 | $1,750 | $8,575 |
| 2018 | $428 | $10,325 | $1,750 | $8,575 |
| 2017 | $439 | $10,640 | $1,750 | $8,890 |
| 2016 | $445 | $10,640 | $1,750 | $8,890 |
| 2015 | $446 | $10,640 | $1,750 | $8,890 |
| 2013 | $499 | $10,640 | $1,750 | $8,890 |
Source: Public Records
Map
Nearby Homes
- 924 Vine St
- 231-233 Sullivan St
- 231 Sullivan St
- 928 Prospect Ave
- 626 Prospect Ave
- 332 Pine St
- 339 Abington Ave
- 922 Ayers St
- 418 Abington Ave
- 358 Brighton Blvd
- 144 Corwin Ave
- 1327 Hickory St
- 0 Cliffwood Ave Unit 5140229
- 1621 State St
- 258 Florence Ave
- 428 Gray St
- 1605 Jackson St
- 833 Market St
- 724 Luck Ave
- 935 Orchard St