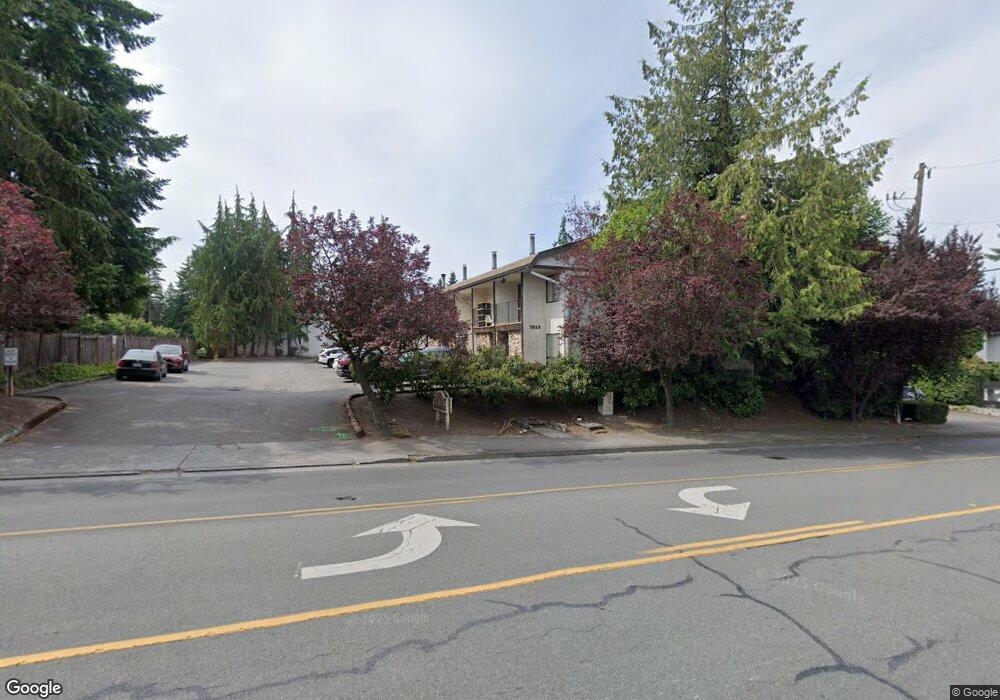
7810 196th St SW Unit A7 Edmonds, WA 98026
East Edmonds NeighborhoodEstimated Value: $373,621 - $396,000
2
Beds
2
Baths
1,100
Sq Ft
$349/Sq Ft
Est. Value
About This Home
This home is located at 7810 196th St SW Unit A7, Edmonds, WA 98026 and is currently estimated at $384,155, approximately $349 per square foot. 7810 196th St SW Unit A7 is a home located in Snohomish County with nearby schools including Edmonds Elementary School, College Place Middle School, and Edmonds-Woodway High School.
Ownership History
Date
Name
Owned For
Owner Type
Purchase Details
Closed on
Sep 29, 2004
Sold by
Morikawa Gordon T and Morikawa Madeline M
Bought by
Chen Huibo
Current Estimated Value
Home Financials for this Owner
Home Financials are based on the most recent Mortgage that was taken out on this home.
Original Mortgage
$97,600
Outstanding Balance
$46,643
Interest Rate
5.25%
Mortgage Type
Unknown
Estimated Equity
$337,512
Purchase Details
Closed on
Oct 17, 2002
Sold by
Garcia Angela A and Leija Flavio F
Bought by
Morikawa Gordon T and Morikawa Mardline M
Home Financials for this Owner
Home Financials are based on the most recent Mortgage that was taken out on this home.
Original Mortgage
$110,050
Interest Rate
6.09%
Purchase Details
Closed on
Feb 11, 2000
Sold by
Lally John E and Brindle Bonnie J Lally
Bought by
Leija Flavio F and Garcia Angela A
Home Financials for this Owner
Home Financials are based on the most recent Mortgage that was taken out on this home.
Original Mortgage
$99,114
Interest Rate
8.14%
Mortgage Type
FHA
Create a Home Valuation Report for This Property
The Home Valuation Report is an in-depth analysis detailing your home's value as well as a comparison with similar homes in the area
Home Values in the Area
Average Home Value in this Area
Purchase History
| Date | Buyer | Sale Price | Title Company |
|---|---|---|---|
| Chen Huibo | $122,000 | Chicago Title | |
| Morikawa Gordon T | $122,300 | -- | |
| Leija Flavio F | $101,500 | -- |
Source: Public Records
Mortgage History
| Date | Status | Borrower | Loan Amount |
|---|---|---|---|
| Open | Chen Huibo | $97,600 | |
| Previous Owner | Morikawa Gordon T | $110,050 | |
| Previous Owner | Leija Flavio F | $99,114 | |
| Closed | Leija Flavio F | $4,060 |
Source: Public Records
Tax History Compared to Growth
Tax History
| Year | Tax Paid | Tax Assessment Tax Assessment Total Assessment is a certain percentage of the fair market value that is determined by local assessors to be the total taxable value of land and additions on the property. | Land | Improvement |
|---|---|---|---|---|
| 2025 | $2,501 | $371,000 | $70,500 | $300,500 |
| 2024 | $2,501 | $353,500 | $68,500 | $285,000 |
| 2023 | $2,322 | $340,000 | $64,000 | $276,000 |
| 2022 | $2,311 | $278,500 | $54,000 | $224,500 |
| 2020 | $2,457 | $264,000 | $48,500 | $215,500 |
| 2019 | $2,198 | $238,000 | $46,000 | $192,000 |
| 2018 | $2,084 | $195,000 | $33,000 | $162,000 |
| 2017 | $1,562 | $153,000 | $32,000 | $121,000 |
| 2016 | $1,395 | $135,500 | $38,500 | $97,000 |
| 2015 | $1,334 | $122,000 | $37,000 | $85,000 |
| 2013 | $1,130 | $97,500 | $30,500 | $67,000 |
Source: Public Records
Map
Nearby Homes
- 19718 76th Ave W Unit C
- 8019 196th St SW Unit C4
- 7606 201st St SW Unit G
- 20111 80th Ave W
- 7702 202nd Place SW
- 20126 81st Ave W
- 7707 203rd St SW
- 18502 18510 76th Ave W
- 8427 200th St SW
- 8516 196th St SW Unit 105
- 8516 196th St SW Unit 302
- 8516 196th St SW Unit 206
- 8516 196th St SW Unit 311
- 8004 203rd Place SW
- 19523 86th Ave W Unit 523
- 18757 76th Ave W
- 19628 68th Ave W
- 20620 76th Ave W Unit A
- 20714 76th Ave W Unit 11
- 20721 81st Ave W
- 7810 196th St SW
- 7810 196th St SW Unit A2
- 7810 196th St SW Unit 2 bed room condo
- 7810 196th St SW Unit A9
- 7810 196th St SW Unit A8
- 7810 196th St SW Unit A6
- 7810 196th St SW Unit A5
- 7810 196th St SW Unit A4
- 7810 196th St SW Unit A3
- 7810 196th St SW Unit A2
- 7810 196th St SW Unit A1
- 7828 196th St SW
- 7812 196th St SW Unit B8
- 7812 196th St SW Unit B7
- 7812 196th St SW Unit B6
- 7812 196th St SW Unit B5
- 7812 196th St SW Unit B4
- 7812 196th St SW Unit B3
- 7812 196th St SW Unit B1
- 7812 196th St SW