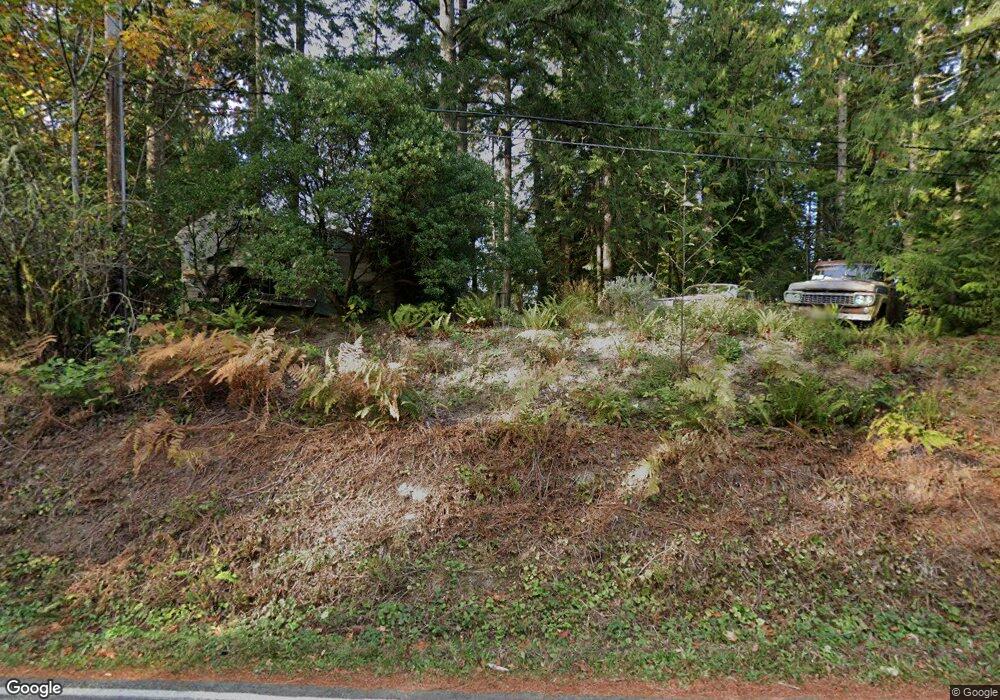
7810 NE Hidden Cove Rd Bainbridge Island, WA 98110
Estimated Value: $1,081,000 - $1,425,000
3
Beds
2
Baths
1,980
Sq Ft
$629/Sq Ft
Est. Value
About This Home
This home is located at 7810 NE Hidden Cove Rd, Bainbridge Island, WA 98110 and is currently estimated at $1,246,255, approximately $629 per square foot. 7810 NE Hidden Cove Rd is a home located in Kitsap County with nearby schools including Bainbridge High School and The Island School.
Ownership History
Date
Name
Owned For
Owner Type
Purchase Details
Closed on
Mar 15, 2005
Sold by
Pickle Scott A and Pickle Michele L
Bought by
Johnsen David Leon
Current Estimated Value
Home Financials for this Owner
Home Financials are based on the most recent Mortgage that was taken out on this home.
Original Mortgage
$359,650
Outstanding Balance
$182,333
Interest Rate
5.61%
Mortgage Type
Purchase Money Mortgage
Estimated Equity
$1,063,922
Purchase Details
Closed on
Sep 23, 2002
Sold by
Maurer Paul R and Maurer Paul Russell
Bought by
Pickle Scott A and Pickle Michele L
Home Financials for this Owner
Home Financials are based on the most recent Mortgage that was taken out on this home.
Original Mortgage
$322,400
Interest Rate
5.25%
Purchase Details
Closed on
Feb 15, 2001
Sold by
Gawlik Dennis M and Gawlik Kimberly S
Bought by
Maurer Paul R
Create a Home Valuation Report for This Property
The Home Valuation Report is an in-depth analysis detailing your home's value as well as a comparison with similar homes in the area
Home Values in the Area
Average Home Value in this Area
Purchase History
| Date | Buyer | Sale Price | Title Company |
|---|---|---|---|
| Johnsen David Leon | $460,000 | Pacific Nw Title | |
| Pickle Scott A | $403,000 | Pacific Nw Title | |
| Maurer Paul R | -- | First American Title Ins |
Source: Public Records
Mortgage History
| Date | Status | Borrower | Loan Amount |
|---|---|---|---|
| Open | Johnsen David Leon | $359,650 | |
| Previous Owner | Pickle Scott A | $322,400 | |
| Closed | Pickle Scott A | $60,450 | |
| Closed | Johnsen David Leon | $53,500 |
Source: Public Records
Tax History Compared to Growth
Tax History
| Year | Tax Paid | Tax Assessment Tax Assessment Total Assessment is a certain percentage of the fair market value that is determined by local assessors to be the total taxable value of land and additions on the property. | Land | Improvement |
|---|---|---|---|---|
| 2026 | $8,490 | $1,046,630 | $356,250 | $690,380 |
| 2025 | $8,490 | $1,046,630 | $356,250 | $690,380 |
| 2024 | $8,114 | $1,046,630 | $356,250 | $690,380 |
| 2023 | $8,466 | $1,046,630 | $356,250 | $690,380 |
| 2022 | $7,774 | $818,400 | $317,880 | $500,520 |
| 2021 | $7,654 | $768,470 | $297,640 | $470,830 |
| 2020 | $7,225 | $714,370 | $275,360 | $439,010 |
| 2019 | $6,659 | $670,690 | $257,140 | $413,550 |
| 2018 | $6,512 | $588,450 | $202,470 | $385,980 |
| 2017 | $6,153 | $588,450 | $202,470 | $385,980 |
| 2016 | $5,699 | $517,320 | $202,470 | $314,850 |
| 2015 | $5,185 | $479,360 | $202,470 | $276,890 |
| 2014 | -- | $447,390 | $202,470 | $244,920 |
| 2013 | -- | $447,390 | $202,470 | $244,920 |
Source: Public Records
Map
Nearby Homes
- 8003 NE Hidden Cove Rd
- 7535 NE West Port Madison Rd
- 13392 Hidden Cove Ln NE
- 0 Ave N
- 13401 Manzanita Rd NE
- 14433 Silven Ave NE
- 14855 Phelps Rd NE
- 8484 NE County Park Rd
- 8552 NE Gordon Dr
- 12170 Viewcrest Place NE
- 0 NE Lovgreen Rd E Unit NWM2419912
- 7131 NE Bay Hill Rd
- 7870 NE Koura Farm Dr
- 16455 Agate Point Rd NE
- 10240 NE Lafayette Ave
- 12079 Sunrise Dr NE
- 11000 Xx State Hwy 305 NE
- 10211 NE Roberts Rd
- 5450 NE Laura Loop
- 9820 NE Beach Crest Dr
- 14042 Running Springs Place NE
- 14016 Hidden Heights Ln NE
- 13954 Hidden Heights Ln NE
- 7804 NE Hidden Cove Rd
- 0 L 114 Hidden Heights Ln NE
- 127 Hidden Heights Ln NE
- 0 Hidden Heights Ln NE
- 13990 Hidden Heights Ln NE
- 13955 Hidden Heights Ln NE
- 7764 NE Hidden Cove Rd
- 14010 Hidden Heights Ln NE
- 13965 Hidden Heights Ln NE
- 8331 Sumanee Place NE
- 14008 Hidden Heights Ln NE
- 8323 Sumanee Place NE
- 13901 Hidden Heights Ln NE
- 13901 Hidden Heights Ln NE
- 7611 NE Hidden Cove Rd
- 8339 Sumanee Place NE
- 8347 Sumanee Place NE