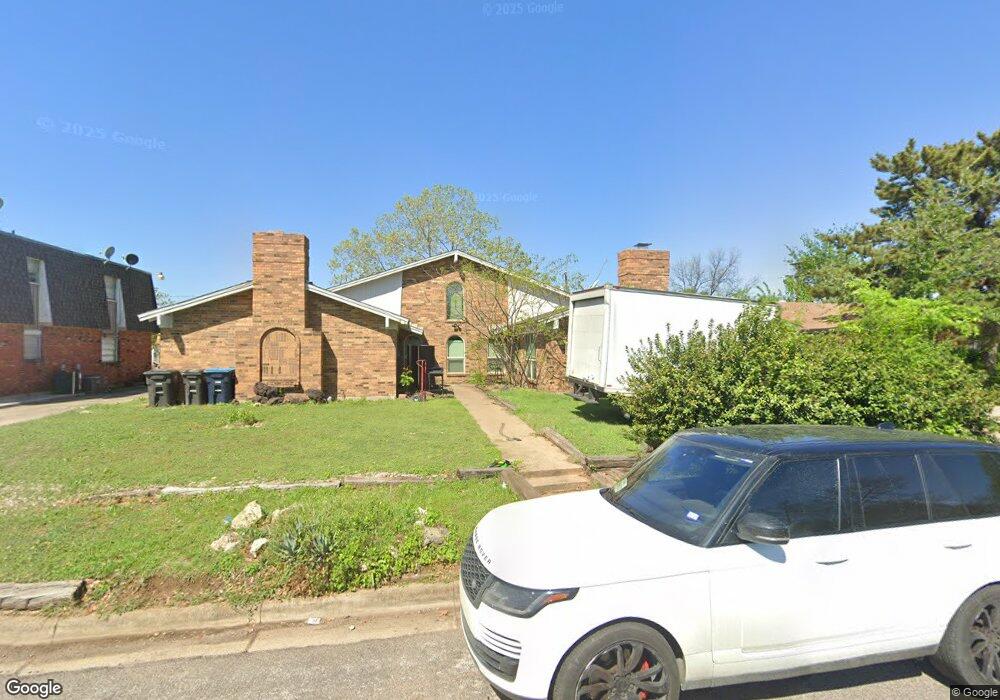
7810 Romney Rd Unit 7810 Fort Worth, TX 76134
Hallmark Camelot NeighborhoodEstimated Value: $311,764 - $329,000
3
Beds
2
Baths
1,481
Sq Ft
$216/Sq Ft
Est. Value
About This Home
This home is located at 7810 Romney Rd Unit 7810, Fort Worth, TX 76134 and is currently estimated at $319,191, approximately $215 per square foot. 7810 Romney Rd Unit 7810 is a home located in Tarrant County with nearby schools including Sycamore Elementary School, H F Stevens Middle School, and Crowley High School.
Ownership History
Date
Name
Owned For
Owner Type
Purchase Details
Closed on
Dec 22, 2017
Sold by
Briggs Clarence A
Bought by
Kiu Wai Yee
Current Estimated Value
Purchase Details
Closed on
Oct 6, 2015
Sold by
Briggs Sharise Ann and Briggs Stephanie Nicole
Bought by
Briggs Clarence A
Purchase Details
Closed on
May 17, 2011
Sold by
Fannie Mae
Bought by
Briggs Clarence A and Briggs David
Purchase Details
Closed on
Apr 5, 2011
Sold by
Kim Hang M and Young Ji
Bought by
Federal National Mortgage Association
Purchase Details
Closed on
Oct 30, 2010
Sold by
Kim Ji Young
Bought by
Kim Hang M
Purchase Details
Closed on
Oct 25, 2005
Sold by
Faulkner Jerry L and Faulkner Julia E
Bought by
Kim Hang M
Home Financials for this Owner
Home Financials are based on the most recent Mortgage that was taken out on this home.
Original Mortgage
$108,000
Interest Rate
1.37%
Mortgage Type
Fannie Mae Freddie Mac
Create a Home Valuation Report for This Property
The Home Valuation Report is an in-depth analysis detailing your home's value as well as a comparison with similar homes in the area
Home Values in the Area
Average Home Value in this Area
Purchase History
| Date | Buyer | Sale Price | Title Company |
|---|---|---|---|
| Kiu Wai Yee | -- | None Available | |
| Briggs Clarence A | -- | None Available | |
| Briggs Clarence A | -- | Old Republic National Title | |
| Federal National Mortgage Association | $64,000 | None Available | |
| Kim Hang M | -- | None Available | |
| Kim Hang M | -- | -- |
Source: Public Records
Mortgage History
| Date | Status | Borrower | Loan Amount |
|---|---|---|---|
| Previous Owner | Kim Hang M | $108,000 |
Source: Public Records
Tax History Compared to Growth
Tax History
| Year | Tax Paid | Tax Assessment Tax Assessment Total Assessment is a certain percentage of the fair market value that is determined by local assessors to be the total taxable value of land and additions on the property. | Land | Improvement |
|---|---|---|---|---|
| 2025 | $5,694 | $233,686 | $30,000 | $203,686 |
| 2024 | $5,694 | $233,686 | $30,000 | $203,686 |
| 2023 | $5,835 | $237,410 | $30,000 | $207,410 |
| 2022 | $5,721 | $207,202 | $30,000 | $177,202 |
| 2021 | $4,660 | $160,450 | $30,000 | $130,450 |
| 2020 | $5,573 | $190,000 | $24,000 | $166,000 |
| 2019 | $5,831 | $190,000 | $24,000 | $166,000 |
| 2018 | $2,348 | $153,000 | $10,000 | $143,000 |
| 2017 | $4,840 | $154,582 | $10,000 | $144,582 |
| 2016 | $4,195 | $133,972 | $10,000 | $123,972 |
| 2015 | $493 | $145,852 | $10,000 | $135,852 |
Source: Public Records
Map
Nearby Homes
- 1325 Florentine Dr
- 1416 Sunny Glen St
- 7 Winship Dr
- 1304 Marlborough Dr
- 7418 Novella Dr
- 1205 Calamian Dr
- 10025 Muntjac Dr
- 10029 Muntjac Dr
- 1201 Marlborough Dr
- 7501 Trimble Dr
- 8401 Autumn Creek Trail
- 7320 Natalie Dr
- 1316 Royster Rd
- 7908 Natalie Dr
- 7937 Trimble Dr
- 8500 Field Creek Ct
- 348 Thompson St
- 7208 Baird Dr
- 312 Cotillion Rd
- 1228 Whittenburg Dr
- 7810 Romney Rd
- 7810 Romney Rd Unit 7808
- 7812 Romney Rd
- 7806 Romney Rd
- 7804 Romney Rd
- 7809 Romney Rd
- 1312 Sycamore School Rd
- 7816 Romney Rd
- 7816 Romney Rd Unit 1
- 7816 Romney Rd Unit 4
- 7813 Romney Rd
- 1301 Pinehurst Dr
- 7805 Romney Rd
- 1305 Pinehurst Dr
- 7817 Romney Rd
- 1309 Pinehurst Dr
- 7801 Romney Rd
- 7812 Pebbleford Rd
- 7808 Pebbleford Rd
- 7816 Pebbleford Rd