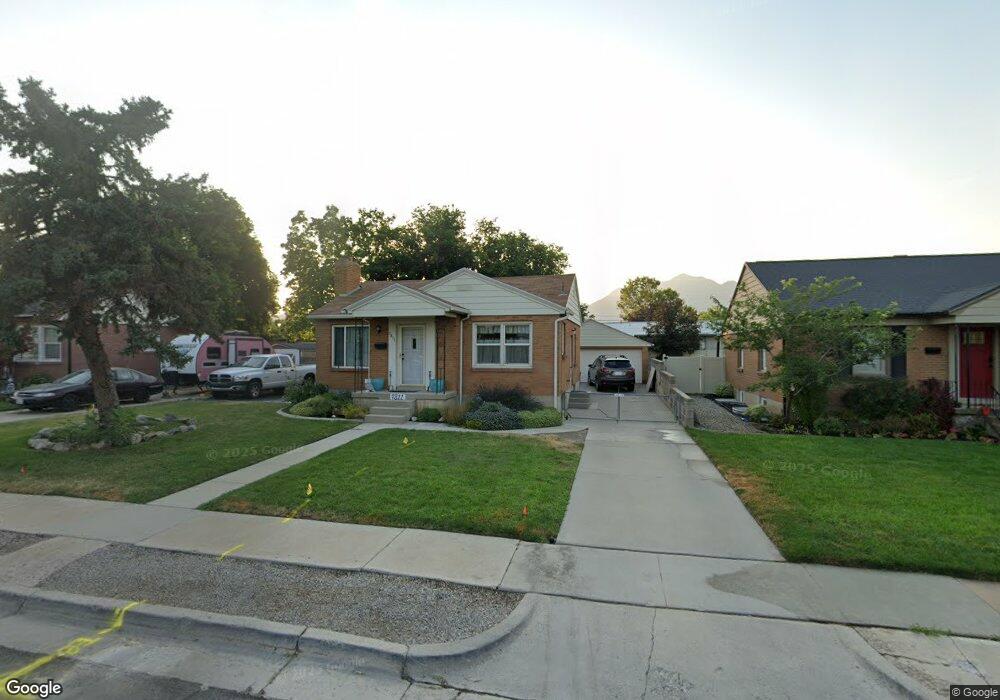
7811 S Coolidge St Midvale, UT 84047
Estimated Value: $449,000 - $548,000
4
Beds
2
Baths
1,778
Sq Ft
$284/Sq Ft
Est. Value
About This Home
This home is located at 7811 S Coolidge St, Midvale, UT 84047 and is currently estimated at $504,296, approximately $283 per square foot. 7811 S Coolidge St is a home located in Salt Lake County with nearby schools including Midvale Elementary School, Midvale Middle School, and Hillcrest High School.
Ownership History
Date
Name
Owned For
Owner Type
Purchase Details
Closed on
Apr 30, 2015
Sold by
Raider Sean and Raider Robin M
Bought by
Golf Savannah M and Giesler Dustin J
Current Estimated Value
Home Financials for this Owner
Home Financials are based on the most recent Mortgage that was taken out on this home.
Original Mortgage
$220,924
Outstanding Balance
$171,357
Interest Rate
3.87%
Mortgage Type
FHA
Estimated Equity
$332,939
Purchase Details
Closed on
Mar 23, 2009
Sold by
Johnson John Bradley and Johnson Shannon Marie
Bought by
Raider Sean and Raider Robin M
Home Financials for this Owner
Home Financials are based on the most recent Mortgage that was taken out on this home.
Original Mortgage
$197,903
Interest Rate
5.15%
Mortgage Type
FHA
Purchase Details
Closed on
May 27, 1994
Sold by
Foster Michael B and Foster Lisa M
Bought by
Johnson John Bradley and Johnson Shannon Marie
Home Financials for this Owner
Home Financials are based on the most recent Mortgage that was taken out on this home.
Original Mortgage
$93,786
Interest Rate
8.3%
Mortgage Type
FHA
Create a Home Valuation Report for This Property
The Home Valuation Report is an in-depth analysis detailing your home's value as well as a comparison with similar homes in the area
Home Values in the Area
Average Home Value in this Area
Purchase History
| Date | Buyer | Sale Price | Title Company |
|---|---|---|---|
| Golf Savannah M | -- | North American Title Llc | |
| Raider Sean | -- | Equity Title | |
| Johnson John Bradley | -- | -- |
Source: Public Records
Mortgage History
| Date | Status | Borrower | Loan Amount |
|---|---|---|---|
| Open | Golf Savannah M | $220,924 | |
| Previous Owner | Raider Sean | $197,903 | |
| Previous Owner | Johnson John Bradley | $93,786 |
Source: Public Records
Tax History
| Year | Tax Paid | Tax Assessment Tax Assessment Total Assessment is a certain percentage of the fair market value that is determined by local assessors to be the total taxable value of land and additions on the property. | Land | Improvement |
|---|---|---|---|---|
| 2025 | $2,487 | $444,400 | $135,400 | $309,000 |
| 2024 | $2,487 | $424,200 | $128,200 | $296,000 |
| 2023 | $2,421 | $410,100 | $121,800 | $288,300 |
| 2022 | $2,554 | $422,400 | $119,400 | $303,000 |
| 2021 | $2,366 | $335,800 | $109,500 | $226,300 |
| 2020 | $2,008 | $270,000 | $79,600 | $190,400 |
| 2019 | $1,866 | $244,900 | $74,600 | $170,300 |
| 2016 | $1,606 | $200,200 | $74,600 | $125,600 |
Source: Public Records
Map
Nearby Homes
- 7703 S Grant St
- 197 W Center St
- 222 W Center St
- 7994 Roosevelt St
- 7571 S Blisswood Dr #20 Dr Unit 20
- 7961 S Pioneer St
- 139 W Columbia Dr
- 125 E 7660 St S Unit 102
- 121 E 7660 St S Unit 101
- 8147 S Roosevelt St
- 120 E 7615 St S Unit 103
- 7588 S Jefferson St
- 30 W 7500 S Unit 18
- 135 E Station St
- 110 Greenwood Ave
- 8218 S Coolidge St
- 353 W 6th Ave
- 76 Marquette Dr
- 7359 S Dewmar Ct W Unit 32
- 7360 S Dewmar Ct W Unit 41
- 7811 Coolidge St
- 7819 Coolidge St
- 7819 S Coolidge St
- 7803 Coolidge St
- 3 Coolidge St
- 7827 S Coolidge St
- 7827 Coolidge St
- 7795 Coolidge St
- 7795 S Coolidge St
- 7816 Wilson St Unit 7818
- 7835 Coolidge St
- 7832 Wilson St
- 7812 Coolidge St
- 7820 Coolidge St
- 7781 Coolidge St
- 7792 Coolidge St
- 121 Taft St
- 7828 S Coolidge St
- 7828 Coolidge St
- 7838 Wilson St