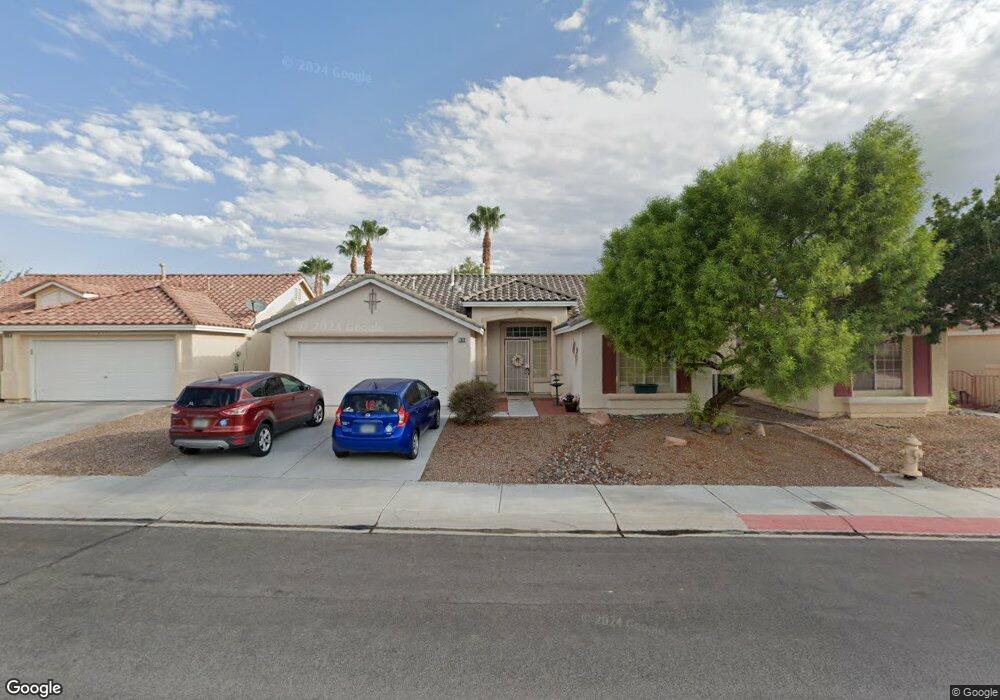
7812 Evident Ct Las Vegas, NV 89131
Elkhorn Ranch NeighborhoodEstimated Value: $416,000 - $434,000
3
Beds
2
Baths
1,583
Sq Ft
$267/Sq Ft
Est. Value
About This Home
This home is located at 7812 Evident Ct, Las Vegas, NV 89131 and is currently estimated at $422,426, approximately $266 per square foot. 7812 Evident Ct is a home located in Clark County with nearby schools including Betsey A Rhodes Elementary School, Ralph Cadwallader Middle School, and Arbor View High School.
Ownership History
Date
Name
Owned For
Owner Type
Purchase Details
Closed on
Jun 30, 2006
Sold by
Garrett Brian S and Garrett Heather
Bought by
Salb Susan T
Current Estimated Value
Home Financials for this Owner
Home Financials are based on the most recent Mortgage that was taken out on this home.
Original Mortgage
$195,000
Outstanding Balance
$115,255
Interest Rate
6.57%
Mortgage Type
Unknown
Estimated Equity
$307,171
Purchase Details
Closed on
Jan 4, 2004
Sold by
Mcneill David J
Bought by
Garrett Brian S and Childers Heather
Home Financials for this Owner
Home Financials are based on the most recent Mortgage that was taken out on this home.
Original Mortgage
$151,200
Interest Rate
5.81%
Mortgage Type
Unknown
Purchase Details
Closed on
Jul 22, 1998
Sold by
Myers Dunmore Homes Llc
Bought by
Mcneill David J
Home Financials for this Owner
Home Financials are based on the most recent Mortgage that was taken out on this home.
Original Mortgage
$127,311
Interest Rate
7.01%
Mortgage Type
VA
Create a Home Valuation Report for This Property
The Home Valuation Report is an in-depth analysis detailing your home's value as well as a comparison with similar homes in the area
Home Values in the Area
Average Home Value in this Area
Purchase History
| Date | Buyer | Sale Price | Title Company |
|---|---|---|---|
| Salb Susan T | $298,000 | Stewart Title Of Nevada | |
| Garrett Brian S | $189,000 | Ticor Title Of Nevada Inc | |
| Mcneill David J | $125,000 | Nevada Title Company |
Source: Public Records
Mortgage History
| Date | Status | Borrower | Loan Amount |
|---|---|---|---|
| Open | Salb Susan T | $195,000 | |
| Previous Owner | Garrett Brian S | $151,200 | |
| Previous Owner | Mcneill David J | $127,311 | |
| Closed | Garrett Brian S | $28,350 |
Source: Public Records
Tax History Compared to Growth
Tax History
| Year | Tax Paid | Tax Assessment Tax Assessment Total Assessment is a certain percentage of the fair market value that is determined by local assessors to be the total taxable value of land and additions on the property. | Land | Improvement |
|---|---|---|---|---|
| 2025 | $1,744 | $91,400 | $30,450 | $60,950 |
| 2024 | $1,693 | $91,400 | $30,450 | $60,950 |
| 2023 | $1,693 | $89,797 | $31,850 | $57,947 |
| 2022 | $1,802 | $79,267 | $26,250 | $53,017 |
| 2021 | $1,669 | $74,605 | $24,150 | $50,455 |
| 2020 | $1,547 | $72,871 | $22,750 | $50,121 |
| 2019 | $1,450 | $69,725 | $20,300 | $49,425 |
| 2018 | $1,383 | $63,391 | $15,750 | $47,641 |
| 2017 | $2,031 | $61,956 | $13,650 | $48,306 |
| 2016 | $1,296 | $56,571 | $11,550 | $45,021 |
| 2015 | $1,292 | $44,147 | $8,750 | $35,397 |
| 2014 | $1,255 | $37,132 | $8,750 | $28,382 |
Source: Public Records
Map
Nearby Homes
- 7801 Olympus Ave Unit 3B
- 7816 Purple Mountain Ave
- 7813 Falconwing Ave
- 7817 Falconwing Ave
- 6804 Rosinwood St
- 7908 Elk Stone Ave
- 7208 Whisper Heights Ct
- 7613 Falconwing Ave
- 7228 Buglehorn St
- 8040 Hesperides Ave
- 6868 Sky Pointe Dr Unit 2091
- 6868 Sky Pointe Dr Unit 1021
- 6868 Sky Pointe Dr Unit 1107
- 6868 Sky Pointe Dr Unit 1087
- 8005 Exploration Ave
- 7133 Savory St
- 0 N Buffalo Dr
- 7320 Misty Glow Ct
- 7229 Robins Roost St
- 8116 Hesperides Ave
- 7816 Evident Ct
- 7808 Evident Ct
- 7005 Steeple Ct
- 7820 Evident Ct
- 7804 Evident Ct
- 7009 Steeple Ct
- 7805 Sierra Rim Dr
- 7001 Steeple Ct
- 7813 Evident Ct
- 7817 Evident Ct
- 7809 Evident Ct
- 7824 Evident Ct
- 7800 Evident Ct
- 7809 Sierra Rim Dr
- 7821 Evident Ct
- 7805 Evident Ct
- 7000 Steeple Ct
- 7825 Evident Ct
- 7828 Evident Ct
- 7813 Sierra Rim Dr