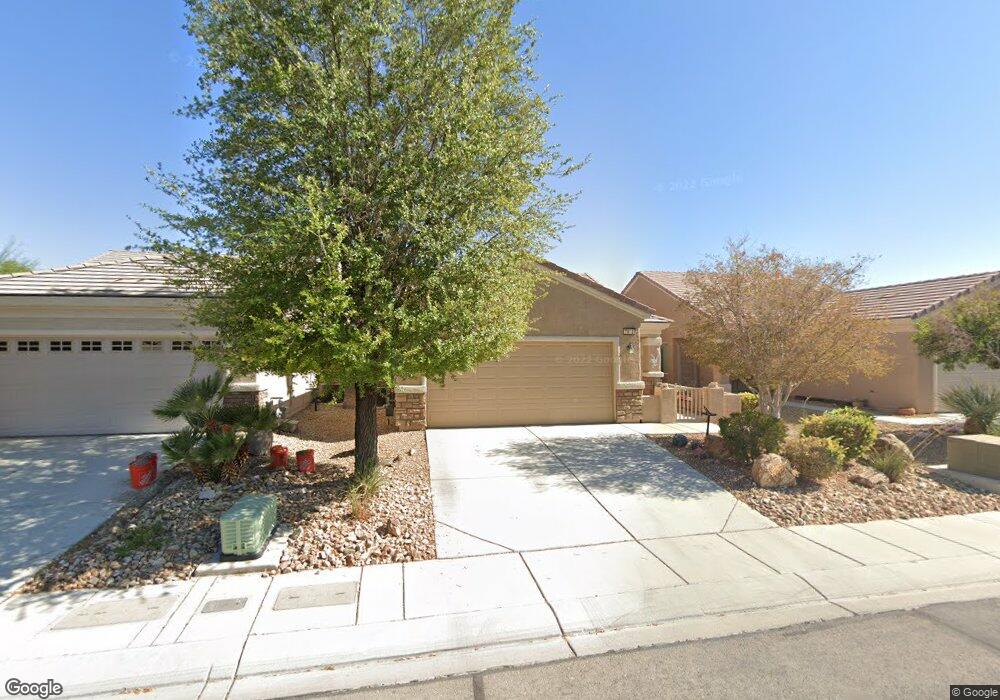
7812 Wading Bird Way North Las Vegas, NV 89084
Aliante NeighborhoodEstimated Value: $349,761 - $370,000
3
Beds
2
Baths
1,246
Sq Ft
$291/Sq Ft
Est. Value
About This Home
This home is located at 7812 Wading Bird Way, North Las Vegas, NV 89084 and is currently estimated at $362,190, approximately $290 per square foot. 7812 Wading Bird Way is a home located in Clark County with nearby schools including Vincent L. Triggs Elementary School, Anthony Saville Middle School, and Shadow Ridge High School.
Ownership History
Date
Name
Owned For
Owner Type
Purchase Details
Closed on
Sep 28, 2020
Sold by
Stallings John L
Bought by
John L Stallings Sr Living Trust and Stallings
Current Estimated Value
Home Financials for this Owner
Home Financials are based on the most recent Mortgage that was taken out on this home.
Original Mortgage
$118,300
Interest Rate
2.93%
Mortgage Type
New Conventional
Purchase Details
Closed on
Jul 25, 2012
Sold by
Stallings John L
Bought by
Stallings John L and John L Stallings Sr Living Trust
Purchase Details
Closed on
Oct 11, 2005
Sold by
Pn Ii Inc
Bought by
Stallings John L and Stallings Carmela
Home Financials for this Owner
Home Financials are based on the most recent Mortgage that was taken out on this home.
Original Mortgage
$150,196
Interest Rate
5.63%
Mortgage Type
Fannie Mae Freddie Mac
Create a Home Valuation Report for This Property
The Home Valuation Report is an in-depth analysis detailing your home's value as well as a comparison with similar homes in the area
Home Values in the Area
Average Home Value in this Area
Purchase History
| Date | Buyer | Sale Price | Title Company |
|---|---|---|---|
| John L Stallings Sr Living Trust | -- | None Listed On Document | |
| Stallings John L | -- | Amrock Llc | |
| Stallings John L | -- | None Available | |
| Stallings John L | $250,328 | Lawyers Title Of Nevada |
Source: Public Records
Mortgage History
| Date | Status | Borrower | Loan Amount |
|---|---|---|---|
| Previous Owner | Stallings John L | $118,300 | |
| Previous Owner | Stallings John L | $150,196 |
Source: Public Records
Tax History Compared to Growth
Tax History
| Year | Tax Paid | Tax Assessment Tax Assessment Total Assessment is a certain percentage of the fair market value that is determined by local assessors to be the total taxable value of land and additions on the property. | Land | Improvement |
|---|---|---|---|---|
| 2025 | $1,645 | $88,130 | $25,200 | $62,930 |
| 2024 | $1,598 | $88,130 | $25,200 | $62,930 |
| 2023 | $1,300 | $86,340 | $27,090 | $59,250 |
| 2022 | $1,551 | $77,380 | $23,310 | $54,070 |
| 2021 | $1,506 | $72,080 | $20,790 | $51,290 |
| 2020 | $1,456 | $70,749 | $20,160 | $50,589 |
| 2019 | $1,413 | $68,029 | $18,270 | $49,759 |
| 2018 | $1,372 | $62,376 | $14,490 | $47,886 |
| 2017 | $1,952 | $57,344 | $9,800 | $47,544 |
| 2016 | $1,300 | $56,110 | $8,575 | $47,535 |
| 2015 | $1,297 | $45,266 | $6,860 | $38,406 |
| 2014 | $1,258 | $38,254 | $4,900 | $33,354 |
Source: Public Records
Map
Nearby Homes
- 7817 Starthroat Ct Unit 8
- 7773 Wading Bird Way
- 7824 Starthroat Ct
- 7751 Widewing Dr
- 2220 Carrier Dove Way
- 7757 Coast Jay St
- 7870 Widewing Dr
- 2525 Willow Wren Dr
- 7908 House Sparrow St
- 7817 Homing Pigeon St
- 2320 Willow Wren Dr
- 7713 Songster St
- 2129 Bay Thrush Way
- 2508 Mourning Warbler Ave
- 2822 Horned Owl Way
- 7716 Homing Pigeon St
- 7737 Nestor Creek Ln
- 1943 Marks River Place
- 7804 Island Rail Dr
- 7905 Grey Teal St
- 7808 Wading Bird Way
- 7816 Wading Bird Way
- 7739 Starthroat Ct
- 7743 Starthroat Ct
- 7813 Wading Bird Way
- 7809 Wading Bird Way
- 7821 Starthroat Ct
- 7817 Wading Bird Way
- 7805 Wading Bird Way
- 7821 Wading Bird Way Unit 8
- 2312 Waxwing Ct
- 7781 Wading Bird Way
- 7825 Starthroat Ct
- 7825 Wading Bird Way
- 2316 Waxwing Ct
- 7777 Wading Bird Way
- 2320 Waxwing Ct
- 2324 Waxwing Ct
- 7829 Wading Bird Way
- 7812 Starthroat Ct