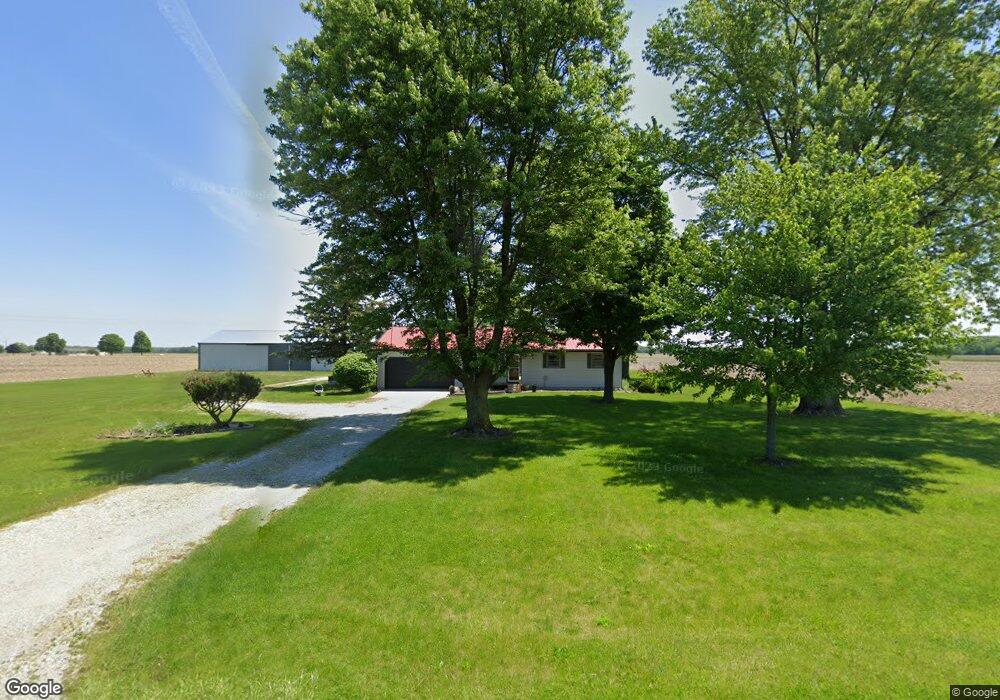
7813 N 300 W-90 Unit 90 Markle, IN 46770
Estimated Value: $222,000 - $259,000
3
Beds
2
Baths
1,584
Sq Ft
$154/Sq Ft
Est. Value
About This Home
This home is located at 7813 N 300 W-90 Unit 90, Markle, IN 46770 and is currently estimated at $244,315, approximately $154 per square foot. 7813 N 300 W-90 Unit 90 is a home located in Wells County with nearby schools including Norwell High School.
Ownership History
Date
Name
Owned For
Owner Type
Purchase Details
Closed on
Oct 12, 2022
Sold by
Olsen Teresa A and Olsen Michael
Bought by
Burnau Dylan W
Current Estimated Value
Home Financials for this Owner
Home Financials are based on the most recent Mortgage that was taken out on this home.
Original Mortgage
$163,200
Outstanding Balance
$157,025
Interest Rate
6.02%
Mortgage Type
New Conventional
Estimated Equity
$87,290
Purchase Details
Closed on
May 4, 2021
Sold by
Olson Teresa A
Bought by
Olsen Teresa A and Olsen Michael
Home Financials for this Owner
Home Financials are based on the most recent Mortgage that was taken out on this home.
Original Mortgage
$80,000
Interest Rate
3.1%
Mortgage Type
New Conventional
Create a Home Valuation Report for This Property
The Home Valuation Report is an in-depth analysis detailing your home's value as well as a comparison with similar homes in the area
Home Values in the Area
Average Home Value in this Area
Purchase History
| Date | Buyer | Sale Price | Title Company |
|---|---|---|---|
| Burnau Dylan W | -- | Springdale Title Llc | |
| Olsen Teresa A | -- | None Available |
Source: Public Records
Mortgage History
| Date | Status | Borrower | Loan Amount |
|---|---|---|---|
| Open | Burnau Dylan W | $163,200 | |
| Previous Owner | Olsen Teresa A | $80,000 |
Source: Public Records
Tax History Compared to Growth
Tax History
| Year | Tax Paid | Tax Assessment Tax Assessment Total Assessment is a certain percentage of the fair market value that is determined by local assessors to be the total taxable value of land and additions on the property. | Land | Improvement |
|---|---|---|---|---|
| 2024 | $1,205 | $216,100 | $52,100 | $164,000 |
| 2023 | $1,165 | $214,000 | $39,100 | $174,900 |
| 2022 | $1,021 | $179,300 | $32,200 | $147,100 |
| 2021 | $887 | $164,300 | $32,200 | $132,100 |
| 2020 | $715 | $151,000 | $32,200 | $118,800 |
| 2019 | $672 | $140,500 | $32,200 | $108,300 |
| 2018 | $516 | $117,100 | $22,600 | $94,500 |
| 2017 | $426 | $116,100 | $22,600 | $93,500 |
| 2016 | $419 | $114,000 | $21,500 | $92,500 |
| 2014 | $380 | $111,600 | $20,700 | $90,900 |
| 2013 | $372 | $106,700 | $19,900 | $86,800 |
Source: Public Records
Map
Nearby Homes
- TBD W 900 N
- 2405 W 900 N
- TBD N 200 W
- TBD N 200 W
- 5798 N 200 W
- 3680 W 550 N
- 5909 N Lincoln St
- TBD N 100 W Unit 2
- TBD N 100 W
- 5970 N Main St
- 5964 N Miller
- 5928 Miller St
- 4255 NW State Road 116-90
- 3869 Indiana 116
- 2501 W 1100 N
- 451 Cottonwood Ct
- 11130 N 300 W
- 310 Cottonwood Ct
- 11136 N 200 W
- 500 W 800 N-90
- 7660 N 300 W-90
- 2840 W 800 N-90 Unit 90
- 7571 N 300 W-90 Unit 90
- 3163 W 800 N-90 Unit 90
- 3163 W 800 N
- 3163 W 800n Rd
- 7505 N 300 W-90 Unit 90
- 8146 N 300 W-90 Unit 90
- 8163 N 300 W-90 Unit 90
- 7440 N 300 W-90 Unit 90
- 8246 N 300 W-90 Unit 90
- 7411 N 300 W-90 Unit 90
- 2582 W 800 N-90 Unit 90
- 7498 N 300 W-90 Unit 90
- 3413 W 800 N-90 Unit 90
- 7327 N 300 W-90 Unit 90
- Section 21 Unit Township 28 N Range
- 8370 N 300 W-90 Unit 90
- 8370 N 300 W-90
- 7271 N 300 W