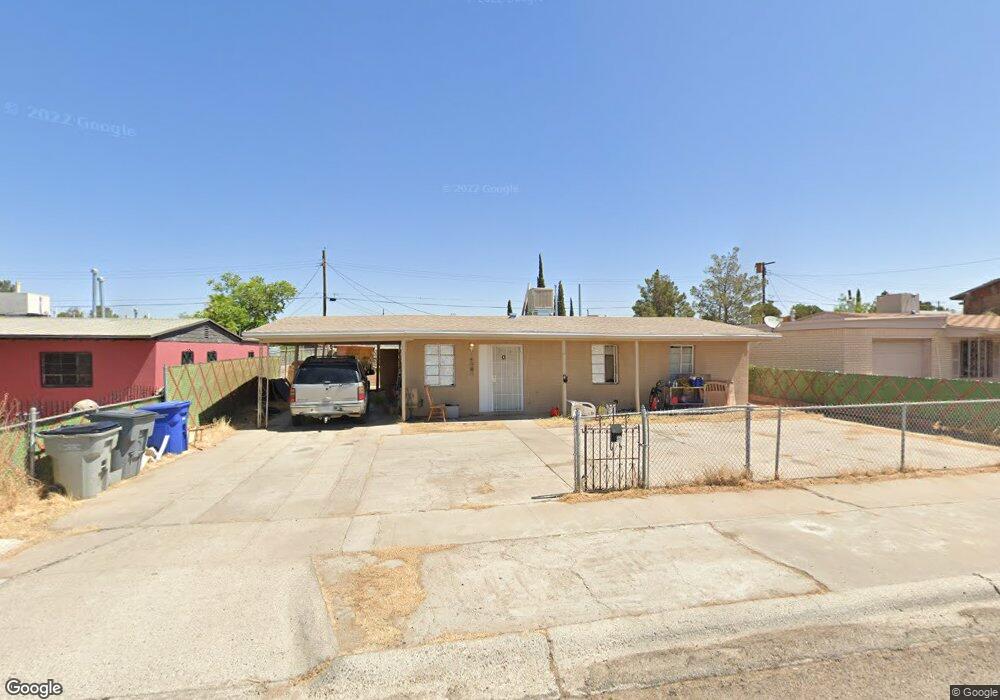
7813 Santa Cruz Ct El Paso, TX 79915
Sageland NeighborhoodEstimated Value: $147,000 - $159,000
3
Beds
2
Baths
1,092
Sq Ft
$141/Sq Ft
Est. Value
About This Home
This home is located at 7813 Santa Cruz Ct, El Paso, TX 79915 and is currently estimated at $153,532, approximately $140 per square foot. 7813 Santa Cruz Ct is a home located in El Paso County with nearby schools including Sageland Elementary School, Bel Air Middle, and Bel Air High School.
Ownership History
Date
Name
Owned For
Owner Type
Purchase Details
Closed on
Oct 4, 2016
Sold by
Mal Development Inc
Bought by
Will Dylan Investments Inc
Current Estimated Value
Home Financials for this Owner
Home Financials are based on the most recent Mortgage that was taken out on this home.
Original Mortgage
$68,000
Outstanding Balance
$8,558
Interest Rate
3.48%
Mortgage Type
New Conventional
Estimated Equity
$144,974
Purchase Details
Closed on
Jul 14, 2015
Sold by
Santana Virginia
Bought by
Mal Development Inc
Purchase Details
Closed on
May 28, 2010
Sold by
Mal Development Inc
Bought by
Santana Virginia
Home Financials for this Owner
Home Financials are based on the most recent Mortgage that was taken out on this home.
Original Mortgage
$77,000
Interest Rate
4.93%
Mortgage Type
Seller Take Back
Purchase Details
Closed on
Mar 16, 2010
Sold by
Tompkins S C
Bought by
Mal Development
Create a Home Valuation Report for This Property
The Home Valuation Report is an in-depth analysis detailing your home's value as well as a comparison with similar homes in the area
Home Values in the Area
Average Home Value in this Area
Purchase History
| Date | Buyer | Sale Price | Title Company |
|---|---|---|---|
| Will Dylan Investments Inc | -- | None Available | |
| Mal Development Inc | $70,000 | None Available | |
| Santana Virginia | -- | None Available | |
| Mal Development | $42,500 | None Available |
Source: Public Records
Mortgage History
| Date | Status | Borrower | Loan Amount |
|---|---|---|---|
| Open | Will Dylan Investments Inc | $68,000 | |
| Previous Owner | Santana Virginia | $77,000 |
Source: Public Records
Tax History Compared to Growth
Tax History
| Year | Tax Paid | Tax Assessment Tax Assessment Total Assessment is a certain percentage of the fair market value that is determined by local assessors to be the total taxable value of land and additions on the property. | Land | Improvement |
|---|---|---|---|---|
| 2025 | $2,966 | $145,573 | $28,951 | $116,622 |
| 2024 | $2,966 | $113,880 | $10,274 | $103,606 |
| 2023 | $2,619 | $90,000 | $12,173 | $77,827 |
| 2022 | $2,137 | $68,805 | $12,173 | $56,632 |
| 2021 | $2,237 | $68,805 | $12,173 | $56,632 |
| 2020 | $2,149 | $68,053 | $12,173 | $55,880 |
| 2019 | $2,136 | $68,053 | $12,173 | $55,880 |
| 2018 | $2,156 | $69,336 | $12,173 | $57,163 |
| 2017 | $2,259 | $70,964 | $12,173 | $58,791 |
| 2016 | $2,169 | $70,964 | $12,173 | $58,791 |
| 2015 | $2,095 | $70,964 | $12,173 | $58,791 |
| 2014 | $2,095 | $73,205 | $12,173 | $61,032 |
Source: Public Records
Map
Nearby Homes
- 812 Santa Barbara Dr
- 7800 Hermosillo Dr
- 844 Santa Barbara Dr
- 7718 Parral Dr
- 7713 Matamoros Dr
- 7832 Ranchland Dr
- 7922 Parral Dr
- 7928 Hermosillo Dr
- 7655 Hacienda Ave
- 7622 Matamoros Dr
- 7761 Maverick Ave
- 7937 San Paulo Dr
- 7542 Hermosillo Dr
- 740 Draco Place
- 7564 Matamoros Dr
- 7975 Esther Rd
- 7534 Taxco Dr
- 537 Emerson St
- 7921 Lirio Rd
- 3 Atkinson Way
- 7809 Santa Cruz Ct
- 7817 Santa Cruz Ct
- 7812 Santa Clara Ct
- 7805 Santa Cruz Ct
- 7816 Santa Clara Ct
- 7808 Santa Clara Ct
- 7821 Santa Cruz Ct
- 7812 Santa Cruz Ct
- 7804 Santa Clara Ct
- 7820 Santa Clara Ct
- 7808 Santa Cruz Ct
- 7816 Santa Cruz Ct
- 7825 Santa Cruz Ct
- 7804 Santa Cruz Ct
- 7820 Santa Cruz Ct
- 7800 Santa Clara Ct
- 7824 Santa Clara Ct
- 7824 Santa Cruz Ct
- 7800 Santa Cruz Ct
- 7829 Santa Cruz Ct