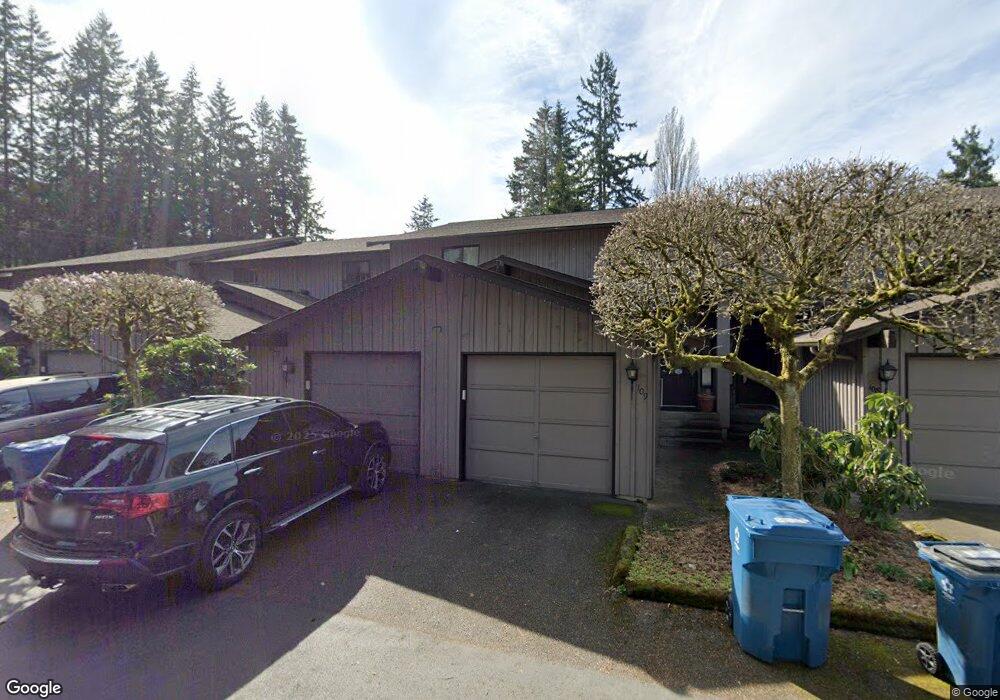
7815 218th St SW Unit 113 Edmonds, WA 98026
Chase Lake NeighborhoodEstimated Value: $427,755 - $478,000
2
Beds
2
Baths
1,066
Sq Ft
$415/Sq Ft
Est. Value
About This Home
This home is located at 7815 218th St SW Unit 113, Edmonds, WA 98026 and is currently estimated at $442,439, approximately $415 per square foot. 7815 218th St SW Unit 113 is a home located in Snohomish County with nearby schools including Chase Lake Elementary School, College Place Middle School, and Edmonds-Woodway High School.
Ownership History
Date
Name
Owned For
Owner Type
Purchase Details
Closed on
Feb 10, 2012
Sold by
Federal National Mortgage Association
Bought by
Massoud Nadien Medhat Refaat G and Massoud Medhat R
Current Estimated Value
Purchase Details
Closed on
Oct 21, 2011
Sold by
Peake Aaron
Bought by
Verity Credit Union
Purchase Details
Closed on
Feb 15, 2007
Sold by
Engel Charles Philip and Engel Penny
Bought by
Peake Aaron
Home Financials for this Owner
Home Financials are based on the most recent Mortgage that was taken out on this home.
Original Mortgage
$212,000
Interest Rate
5.75%
Mortgage Type
Purchase Money Mortgage
Purchase Details
Closed on
Oct 25, 1995
Sold by
Lejeune Diana R
Bought by
Engel Charles Philip and Engel Penny
Home Financials for this Owner
Home Financials are based on the most recent Mortgage that was taken out on this home.
Original Mortgage
$74,000
Interest Rate
7.59%
Create a Home Valuation Report for This Property
The Home Valuation Report is an in-depth analysis detailing your home's value as well as a comparison with similar homes in the area
Home Values in the Area
Average Home Value in this Area
Purchase History
| Date | Buyer | Sale Price | Title Company |
|---|---|---|---|
| Massoud Nadien Medhat Refaat G | -- | Servicelink | |
| Verity Credit Union | $189,412 | Accommodation | |
| Peake Aaron | $212,000 | Rainier Title | |
| Engel Charles Philip | $92,500 | -- |
Source: Public Records
Mortgage History
| Date | Status | Borrower | Loan Amount |
|---|---|---|---|
| Previous Owner | Peake Aaron | $212,000 | |
| Previous Owner | Engel Charles Philip | $74,000 |
Source: Public Records
Tax History Compared to Growth
Tax History
| Year | Tax Paid | Tax Assessment Tax Assessment Total Assessment is a certain percentage of the fair market value that is determined by local assessors to be the total taxable value of land and additions on the property. | Land | Improvement |
|---|---|---|---|---|
| 2025 | $3,047 | $470,000 | $85,000 | $385,000 |
| 2024 | $3,047 | $431,000 | $75,000 | $356,000 |
| 2023 | $2,710 | $397,000 | $68,000 | $329,000 |
| 2022 | $2,696 | $325,000 | $57,000 | $268,000 |
| 2020 | $2,754 | $296,000 | $65,000 | $231,000 |
| 2019 | $2,566 | $278,000 | $59,000 | $219,000 |
| 2018 | $2,777 | $260,000 | $53,000 | $207,000 |
| 2017 | $2,477 | $243,000 | $49,000 | $194,000 |
| 2016 | $1,780 | $173,000 | $48,000 | $125,000 |
| 2015 | $1,639 | $150,000 | $45,500 | $104,500 |
| 2013 | $1,297 | $112,000 | $45,500 | $66,500 |
Source: Public Records
Map
Nearby Homes
- 7909 218th St SW Unit 4
- 7923 220th St SW
- 7924 212th St SW Unit 211
- 7924 212th St SW Unit 104
- 8012 222nd St SW
- 22210 80th Ave W
- 7628 222nd St SW Unit B4
- 21505 84th Ave W
- 21224 82nd Place W
- 8225 212th St SW Unit 304
- 7505 212th St SW Unit C301
- 7503 212th St SW Unit B302
- 7311 224th St SW Unit C5
- 228 xx 84th Ave W
- 7205 224th St SW Unit M6
- 22604 78th Ave W
- 8500 Main St Unit F313
- 8500 Main St Unit F-209
- 8500 Main St Unit F205
- 7207 210th St SW Unit 202
- 7815 218th St SW Unit 116
- 7815 218th St SW Unit 115
- 7815 218th St SW Unit 114
- 7815 218th St SW Unit 112
- 7815 218th St SW Unit 111
- 7815 218th St SW Unit 110
- 7815 218th St SW Unit 109
- 7815 218th St SW Unit 108
- 7815 218th St SW Unit 107
- 7815 218th St SW Unit 106
- 7815 218th St SW Unit 105
- 7815 218th St SW Unit 104
- 7815 218th St SW Unit 103
- 7815 218th St SW Unit 102
- 7815 218th St SW Unit 101
- 7905 218th St SW Unit E-5
- 7905 218th St SW Unit C3
- 7909 218th St SW
- 7909 218th St SW Unit 5
- 7909 218th St SW Unit H