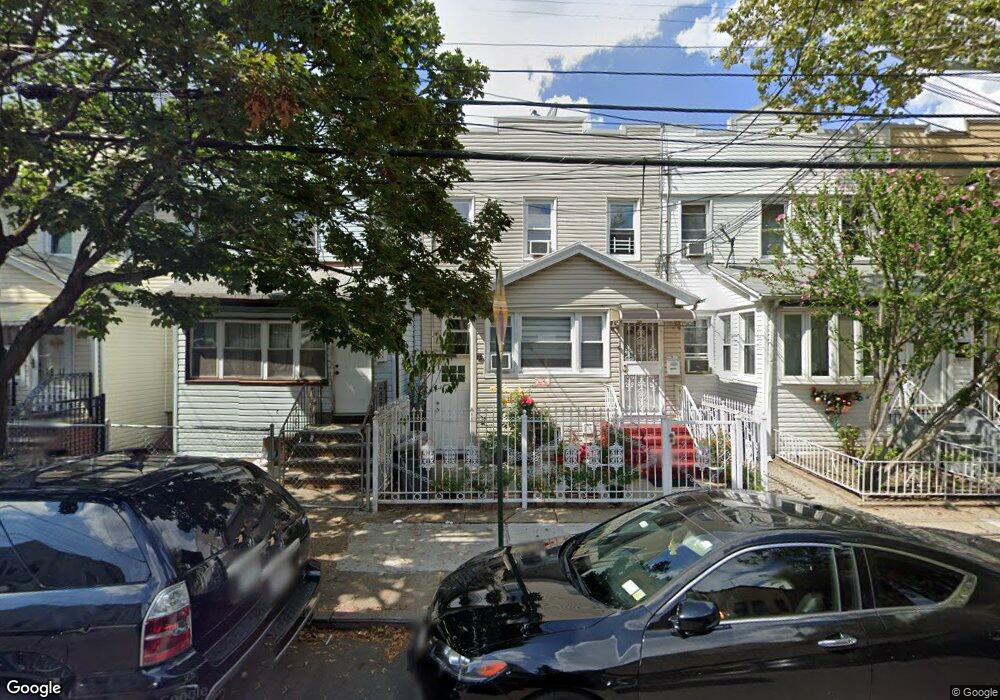
7815 95th Ave Ozone Park, NY 11416
Ozone Park NeighborhoodEstimated Value: $592,000 - $749,000
--
Bed
--
Bath
1,252
Sq Ft
$533/Sq Ft
Est. Value
About This Home
This home is located at 7815 95th Ave, Ozone Park, NY 11416 and is currently estimated at $667,224, approximately $532 per square foot. 7815 95th Ave is a home located in Queens County with nearby schools including P.S. 060 Woodhaven, Santiam Elementary School, and Alice Ott Middle School.
Ownership History
Date
Name
Owned For
Owner Type
Purchase Details
Closed on
Sep 30, 2014
Sold by
Reyes Ibis
Bought by
Miah Mohamed M and Mohith Mohamed A
Current Estimated Value
Home Financials for this Owner
Home Financials are based on the most recent Mortgage that was taken out on this home.
Original Mortgage
$231,000
Outstanding Balance
$176,005
Interest Rate
4.09%
Mortgage Type
New Conventional
Estimated Equity
$491,219
Purchase Details
Closed on
Jan 11, 2011
Sold by
Lomonaco Deceased Peter and Lomonaco Lomonaco
Bought by
Lomonaco Ann Marie
Create a Home Valuation Report for This Property
The Home Valuation Report is an in-depth analysis detailing your home's value as well as a comparison with similar homes in the area
Home Values in the Area
Average Home Value in this Area
Purchase History
| Date | Buyer | Sale Price | Title Company |
|---|---|---|---|
| Miah Mohamed M | $330,000 | -- | |
| Miah Mohamed M | $330,000 | -- | |
| Lomonaco Ann Marie | -- | -- | |
| Lomonaco Ann Marie | -- | -- |
Source: Public Records
Mortgage History
| Date | Status | Borrower | Loan Amount |
|---|---|---|---|
| Open | Miah Mohamed M | $231,000 | |
| Closed | Miah Mohamed M | $231,000 |
Source: Public Records
Tax History Compared to Growth
Tax History
| Year | Tax Paid | Tax Assessment Tax Assessment Total Assessment is a certain percentage of the fair market value that is determined by local assessors to be the total taxable value of land and additions on the property. | Land | Improvement |
|---|---|---|---|---|
| 2025 | $5,354 | $28,232 | $7,427 | $20,805 |
| 2024 | $5,354 | $26,656 | $8,400 | $18,256 |
| 2023 | $5,095 | $25,367 | $8,863 | $16,504 |
| 2022 | $4,889 | $34,560 | $11,760 | $22,800 |
| 2021 | $5,066 | $36,960 | $11,760 | $25,200 |
| 2020 | $4,980 | $32,040 | $11,760 | $20,280 |
| 2019 | $4,647 | $32,400 | $11,760 | $20,640 |
| 2018 | $4,422 | $21,139 | $8,404 | $12,735 |
| 2017 | $4,090 | $20,062 | $10,187 | $9,875 |
| 2016 | $3,390 | $20,062 | $10,187 | $9,875 |
| 2015 | -- | $19,606 | $11,939 | $7,667 |
Source: Public Records
Map
Nearby Homes