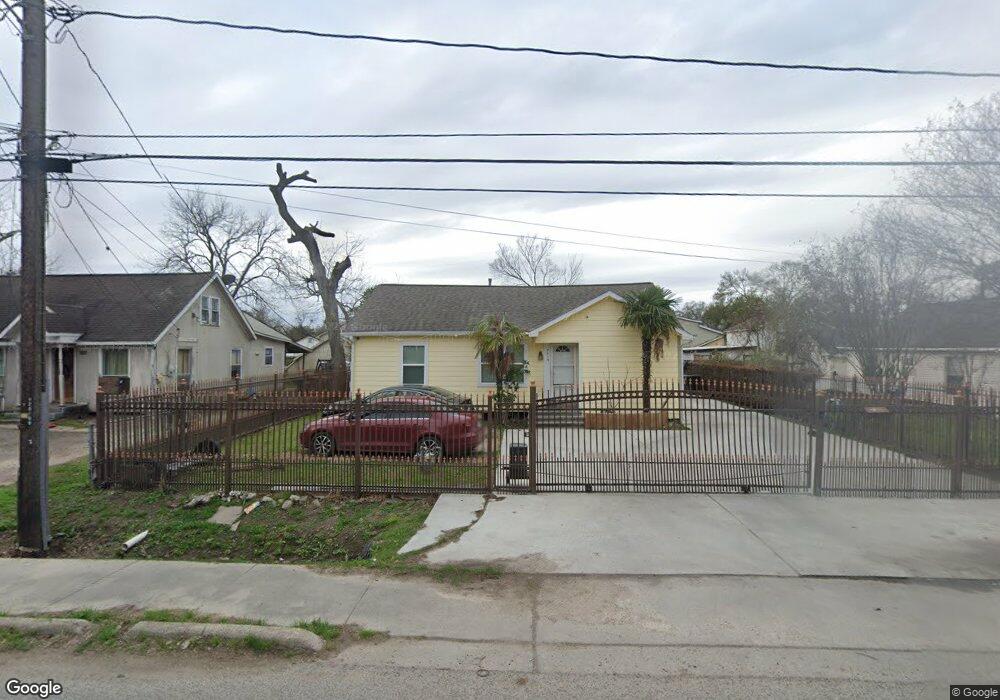
7815 Helmers St Houston, TX 77022
Northside-Northline NeighborhoodEstimated Value: $192,000 - $274,000
2
Beds
1
Bath
1,000
Sq Ft
$247/Sq Ft
Est. Value
About This Home
This home is located at 7815 Helmers St, Houston, TX 77022 and is currently estimated at $247,385, approximately $247 per square foot. 7815 Helmers St is a home located in Harris County with nearby schools including Janowski Elementary School, Burbank Middle School, and Sam Houston Math, Science & Technology Center.
Ownership History
Date
Name
Owned For
Owner Type
Purchase Details
Closed on
Oct 17, 2019
Sold by
Velarde Dora
Bought by
Loya Francisco R
Current Estimated Value
Purchase Details
Closed on
Oct 24, 2018
Sold by
Nationstar Mortgage Llc
Bought by
Loya Francisco Rivera
Purchase Details
Closed on
May 18, 2006
Sold by
Hubacek Michael R
Bought by
Rivera Francisco and Rivera Rosario
Home Financials for this Owner
Home Financials are based on the most recent Mortgage that was taken out on this home.
Original Mortgage
$66,000
Interest Rate
6.5%
Mortgage Type
Purchase Money Mortgage
Purchase Details
Closed on
May 13, 2003
Sold by
Vasquez Linda
Bought by
Hubacek Michael R
Purchase Details
Closed on
May 6, 2003
Sold by
Savala Michelle and Vasquez Michael
Bought by
Vasquez Linda
Purchase Details
Closed on
Jul 12, 2000
Sold by
Escobedo Aurora Franco
Bought by
Vasquez Justo Mike and Vasquez Linda
Create a Home Valuation Report for This Property
The Home Valuation Report is an in-depth analysis detailing your home's value as well as a comparison with similar homes in the area
Home Values in the Area
Average Home Value in this Area
Purchase History
| Date | Buyer | Sale Price | Title Company |
|---|---|---|---|
| Loya Francisco R | -- | Momentum Title | |
| Loya Francisco Rivera | -- | None Available | |
| Rivera Francisco | -- | None Available | |
| Hubacek Michael R | -- | Fidelity National Title | |
| Vasquez Linda | -- | Fidelity National Title | |
| Vasquez Justo Mike | -- | -- |
Source: Public Records
Mortgage History
| Date | Status | Borrower | Loan Amount |
|---|---|---|---|
| Previous Owner | Rivera Francisco | $66,000 |
Source: Public Records
Tax History Compared to Growth
Tax History
| Year | Tax Paid | Tax Assessment Tax Assessment Total Assessment is a certain percentage of the fair market value that is determined by local assessors to be the total taxable value of land and additions on the property. | Land | Improvement |
|---|---|---|---|---|
| 2025 | $2,492 | $261,819 | $101,141 | $160,678 |
| 2024 | $2,492 | $244,664 | $92,823 | $151,841 |
| 2023 | $2,492 | $266,508 | $56,559 | $209,949 |
| 2022 | $3,647 | $221,065 | $56,559 | $164,506 |
| 2021 | $3,509 | $179,122 | $56,559 | $122,563 |
| 2020 | $3,315 | $163,580 | $56,559 | $107,021 |
| 2019 | $3,149 | $159,737 | $46,578 | $113,159 |
| 2018 | $2,000 | $131,143 | $38,926 | $92,217 |
| 2017 | $2,600 | $131,143 | $38,926 | $92,217 |
| 2016 | $1,498 | $65,973 | $36,597 | $29,376 |
| 2015 | $934 | $53,851 | $26,616 | $27,235 |
| 2014 | $934 | $53,851 | $26,616 | $27,235 |
Source: Public Records
Map
Nearby Homes
- 0 Appleton St
- 631 Apache St
- 714 Apache St
- 802 Berry Sage Ln
- 8402 Berry Green Ln
- 8411 Berry Brush Ln
- 8205 Appleton St
- 743 Apache St
- 726 Mcdaniel St
- 7523 Roswell St
- 741 Mcdaniel St
- 428 Van Molan St
- 729 Caperton St
- 88 Berry Rd
- 212B Garrotsville St
- 212A Garrotsville St
- 243 Rebecca St Unit E
- 243 Rebecca St Unit F
- 121-123 Van Molan St
- 241 Rebecca St Unit A
- 7813 Helmers St
- 7819 Helmers St
- 508 Apache St
- 512 Apache St
- 7811 Helmers St
- 7818 Melrose St
- 7814 Melrose St
- 7820 Melrose St
- 7803 Helmers St
- 7901 Helmers St
- 7816 Helmers St
- 7820 Helmers St
- 7812 Helmers St
- 7808 Helmers St
- 535 Apache St
- 7907 Helmers St
- 7801 Helmers St
- 7810 Melrose St
- 7902 Helmers St
- 7804 Helmers St