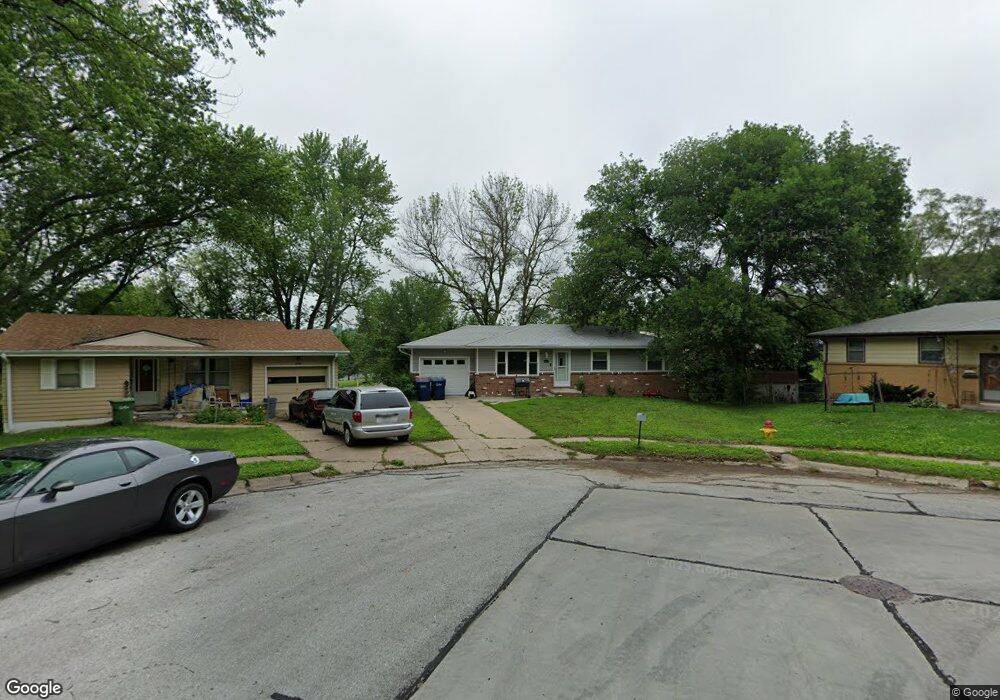
7816 Arends Cir Bellevue, NE 68147
Estimated Value: $213,053 - $252,000
3
Beds
4
Baths
1,082
Sq Ft
$217/Sq Ft
Est. Value
About This Home
This home is located at 7816 Arends Cir, Bellevue, NE 68147 and is currently estimated at $235,263, approximately $217 per square foot. 7816 Arends Cir is a home located in Sarpy County with nearby schools including Chandler View Elementary School, Bryan Middle School, and Bryan High School.
Ownership History
Date
Name
Owned For
Owner Type
Purchase Details
Closed on
May 23, 2016
Sold by
Schwarz Celine and Krewson Christian L
Bought by
Krewson Celine and Krewson Christina L
Current Estimated Value
Home Financials for this Owner
Home Financials are based on the most recent Mortgage that was taken out on this home.
Original Mortgage
$101,400
Outstanding Balance
$44,800
Interest Rate
3.58%
Estimated Equity
$190,463
Purchase Details
Closed on
Mar 19, 2007
Sold by
Diehm Andrew E and Diehm Michelle R
Bought by
Schwarz Celine
Home Financials for this Owner
Home Financials are based on the most recent Mortgage that was taken out on this home.
Original Mortgage
$112,500
Interest Rate
6.3%
Purchase Details
Closed on
Feb 7, 2001
Sold by
Diehm Andrew E and Diehm Michelle R
Bought by
Diehm Andrew E and Diehm Michelle R
Create a Home Valuation Report for This Property
The Home Valuation Report is an in-depth analysis detailing your home's value as well as a comparison with similar homes in the area
Home Values in the Area
Average Home Value in this Area
Purchase History
| Date | Buyer | Sale Price | Title Company |
|---|---|---|---|
| Krewson Celine | -- | Nebraska Title Company O | |
| Schwarz Celine | $113,000 | Nlta | |
| Diehm Andrew E | -- | -- |
Source: Public Records
Mortgage History
| Date | Status | Borrower | Loan Amount |
|---|---|---|---|
| Open | Krewson Celine | $101,400 | |
| Closed | Schwarz Celine | $112,500 |
Source: Public Records
Tax History Compared to Growth
Tax History
| Year | Tax Paid | Tax Assessment Tax Assessment Total Assessment is a certain percentage of the fair market value that is determined by local assessors to be the total taxable value of land and additions on the property. | Land | Improvement |
|---|---|---|---|---|
| 2025 | $2,956 | $178,864 | $35,000 | $143,864 |
| 2024 | $3,420 | $174,445 | $30,000 | $144,445 |
| 2023 | $3,420 | $158,422 | $30,000 | $128,422 |
| 2022 | $2,929 | $134,162 | $24,000 | $110,162 |
| 2021 | $2,579 | $117,360 | $24,000 | $93,360 |
| 2020 | $2,492 | $112,684 | $20,000 | $92,684 |
| 2019 | $2,335 | $105,376 | $20,000 | $85,376 |
| 2018 | $2,226 | $99,738 | $20,000 | $79,738 |
| 2017 | $2,185 | $97,407 | $20,000 | $77,407 |
| 2016 | $2,110 | $94,741 | $20,000 | $74,741 |
| 2015 | $1,969 | $89,118 | $20,000 | $69,118 |
| 2014 | $1,998 | $91,169 | $20,000 | $71,169 |
| 2012 | -- | $96,580 | $20,000 | $76,580 |
Source: Public Records
Map
Nearby Homes
- 7735 S 30th St
- 2904 Greene Ave
- 7616 S 33rd Ave
- 7612 S 33rd Ave
- 7608 S 33rd Ave
- 7703 S 34th St
- 7518 Chandler Acres Dr
- 7613 S 34th St
- 2831 Lillian St
- 7224 Blue Ridge Dr
- 7220 Blue Ridge Dr
- 7602 Sarpy Ave
- 3701 Groves Rd
- 7306 Sarpy Ave
- 3708 Greene Ave
- 2815 Emiline St
- 7304 S 26th St
- 8006 Groves Cir
- 7639 S 39th Ave
- 2605 Virginia St
- 7820 Arends Cir
- 7813 Arends Cir
- 7824 Arends Cir
- 7809 Arends Cir
- 7805 Arends Cir
- 3112 Albert St
- 3104 Albert St
- 7826 S 32nd St
- 7802 S 32nd St
- 3014 Albert St
- 7732 S 31st St
- 3115 Albert St
- 3107 Albert St
- 3010 Albert St
- 7731 S 31st St
- 3013 Albert St
- 3006 Albert St
- 7738 S 30th St
- 3110 Evelyn St
- 7818 S 30th St