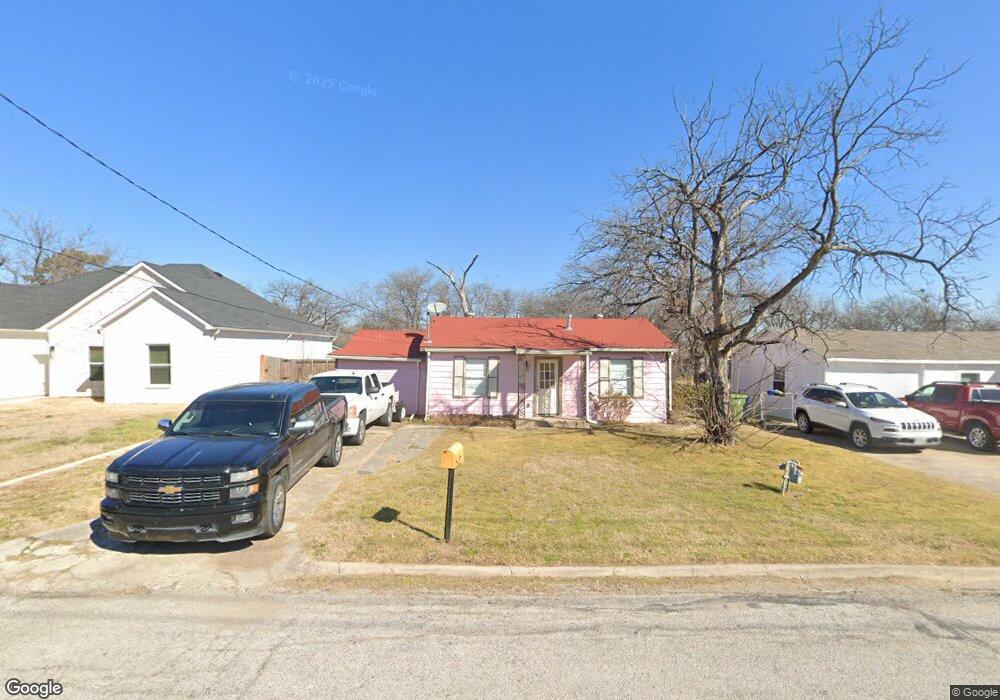
7816 Tacoma Dr Fort Worth, TX 76108
Estimated Value: $171,000 - $222,000
3
Beds
1
Bath
720
Sq Ft
$267/Sq Ft
Est. Value
About This Home
This home is located at 7816 Tacoma Dr, Fort Worth, TX 76108 and is currently estimated at $192,243, approximately $267 per square foot. 7816 Tacoma Dr is a home located in Tarrant County with nearby schools including Liberty Elementary School, Brewer Middle School, and Tannahill Intermediate School.
Ownership History
Date
Name
Owned For
Owner Type
Purchase Details
Closed on
Jan 7, 2022
Sold by
Daniel Delavega
Bought by
Chavez Ignacio
Current Estimated Value
Purchase Details
Closed on
Jan 24, 2005
Sold by
Weakley Walter E
Bought by
Delavega Daniel
Home Financials for this Owner
Home Financials are based on the most recent Mortgage that was taken out on this home.
Original Mortgage
$46,800
Interest Rate
5.68%
Mortgage Type
Purchase Money Mortgage
Purchase Details
Closed on
Jan 28, 2004
Sold by
Eldredge Larry Dwayne and Eldredge Vickie Lynn
Bought by
Weakley Walter E
Purchase Details
Closed on
May 17, 1995
Sold by
Weakley Walter E
Bought by
Eldredge Larry Dwayne and Eldredge Vicki Lynn
Home Financials for this Owner
Home Financials are based on the most recent Mortgage that was taken out on this home.
Original Mortgage
$33,000
Interest Rate
8.36%
Mortgage Type
Seller Take Back
Create a Home Valuation Report for This Property
The Home Valuation Report is an in-depth analysis detailing your home's value as well as a comparison with similar homes in the area
Home Values in the Area
Average Home Value in this Area
Purchase History
| Date | Buyer | Sale Price | Title Company |
|---|---|---|---|
| Chavez Ignacio | -- | None Listed On Document | |
| Chavez Ignacio | -- | None Listed On Document | |
| Delavega Daniel | -- | Alamo Title Company | |
| Weakley Walter E | -- | -- | |
| Eldredge Larry Dwayne | -- | American Title Company |
Source: Public Records
Mortgage History
| Date | Status | Borrower | Loan Amount |
|---|---|---|---|
| Previous Owner | Delavega Daniel | $46,800 | |
| Previous Owner | Eldredge Larry Dwayne | $33,000 |
Source: Public Records
Tax History Compared to Growth
Tax History
| Year | Tax Paid | Tax Assessment Tax Assessment Total Assessment is a certain percentage of the fair market value that is determined by local assessors to be the total taxable value of land and additions on the property. | Land | Improvement |
|---|---|---|---|---|
| 2025 | $3,711 | $156,649 | $50,938 | $105,711 |
| 2024 | $3,711 | $156,649 | $50,938 | $105,711 |
| 2023 | $4,070 | $171,168 | $50,938 | $120,230 |
| 2022 | $3,251 | $120,047 | $25,000 | $95,047 |
| 2021 | $3,114 | $113,205 | $25,000 | $88,205 |
| 2020 | $2,779 | $100,289 | $25,000 | $75,289 |
| 2019 | $2,905 | $100,999 | $25,000 | $75,999 |
| 2018 | $1,726 | $60,000 | $12,000 | $48,000 |
| 2017 | $1,471 | $50,337 | $12,000 | $38,337 |
| 2016 | $1,535 | $52,528 | $12,000 | $40,528 |
| 2015 | $893 | $30,500 | $12,000 | $18,500 |
| 2014 | $893 | $31,100 | $9,000 | $22,100 |
Source: Public Records
Map
Nearby Homes
- 7836 Corina Dr
- 7805 Whitney Dr
- 867 Odie Dr
- 730 S Cherry Ln
- 852 Odie Dr
- 7704 Carlos St
- 801 Ala Dr
- 149 Wilson Cliff Dr
- 872 June Dr
- 501 Odie Dr
- 633 Kimbrough St
- 537 June Dr
- 8016 Downe Dr
- 2248 Tierra Madre Blvd
- 8017 White Settlement Rd
- 321 Meadow Park Dr
- 2220 Crested Saguaro St
- 2228 Crested Saguaro St
- 8232 Redonda St
- 8203 Delmar St
- 7820 Tacoma Dr
- 7812 Tacoma Dr
- 7824 Tacoma Dr
- 7808 Tacoma Dr
- 7813 Corina Dr
- 7828 Tacoma Dr
- 7809 Corina Dr
- 7829 Corina Dr
- 7817 Tacoma Dr
- 7813 Tacoma Dr
- 7821 Tacoma Dr
- 7832 Tacoma Dr
- 7800 Tacoma Dr
- 7809 Tacoma Dr
- 7805 Corina Dr
- 7805 Corina Dr Unit B
- 7825 Tacoma Dr
- 7833 Corina Dr
- 7833 Corina Dr
- 7805 Tacoma Dr