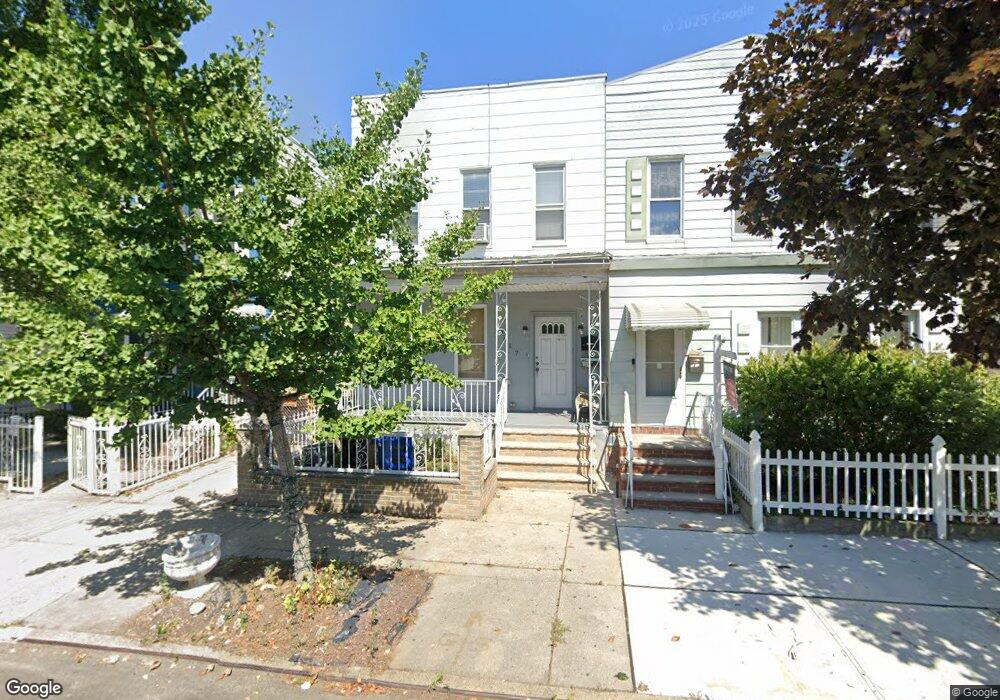
7817 90th Rd Woodhaven, NY 11421
Woodhaven NeighborhoodEstimated Value: $890,432 - $991,000
--
Bed
--
Bath
1,880
Sq Ft
$504/Sq Ft
Est. Value
About This Home
This home is located at 7817 90th Rd, Woodhaven, NY 11421 and is currently estimated at $946,858, approximately $503 per square foot. 7817 90th Rd is a home located in Queens County with nearby schools including P.S. 060 Woodhaven, Santiam Elementary School, and Alice Ott Middle School.
Ownership History
Date
Name
Owned For
Owner Type
Purchase Details
Closed on
Aug 27, 2010
Sold by
Lopez Medarda and Lopez Ramon O
Bought by
Macenat Alan and Nivela Nathali
Current Estimated Value
Home Financials for this Owner
Home Financials are based on the most recent Mortgage that was taken out on this home.
Original Mortgage
$460,202
Outstanding Balance
$304,964
Interest Rate
4.51%
Mortgage Type
Commercial
Estimated Equity
$641,894
Create a Home Valuation Report for This Property
The Home Valuation Report is an in-depth analysis detailing your home's value as well as a comparison with similar homes in the area
Home Values in the Area
Average Home Value in this Area
Purchase History
| Date | Buyer | Sale Price | Title Company |
|---|---|---|---|
| Macenat Alan | $466,400 | -- |
Source: Public Records
Mortgage History
| Date | Status | Borrower | Loan Amount |
|---|---|---|---|
| Open | Macenat Alan | $460,202 |
Source: Public Records
Tax History Compared to Growth
Tax History
| Year | Tax Paid | Tax Assessment Tax Assessment Total Assessment is a certain percentage of the fair market value that is determined by local assessors to be the total taxable value of land and additions on the property. | Land | Improvement |
|---|---|---|---|---|
| 2025 | $6,735 | $35,506 | $11,159 | $24,347 |
| 2024 | $6,735 | $33,534 | $10,268 | $23,266 |
| 2023 | $6,735 | $33,534 | $11,270 | $22,264 |
| 2022 | $6,351 | $47,220 | $17,160 | $30,060 |
| 2021 | $6,598 | $39,120 | $17,160 | $21,960 |
| 2020 | $6,263 | $42,240 | $17,160 | $25,080 |
| 2019 | $5,846 | $44,760 | $17,160 | $27,600 |
| 2018 | $5,697 | $27,945 | $15,223 | $12,722 |
| 2017 | $5,404 | $26,512 | $12,765 | $13,747 |
| 2016 | $5,223 | $26,512 | $12,765 | $13,747 |
| 2015 | $2,797 | $24,657 | $16,404 | $8,253 |
| 2014 | $2,797 | $23,288 | $18,514 | $4,774 |
Source: Public Records
Map
Nearby Homes