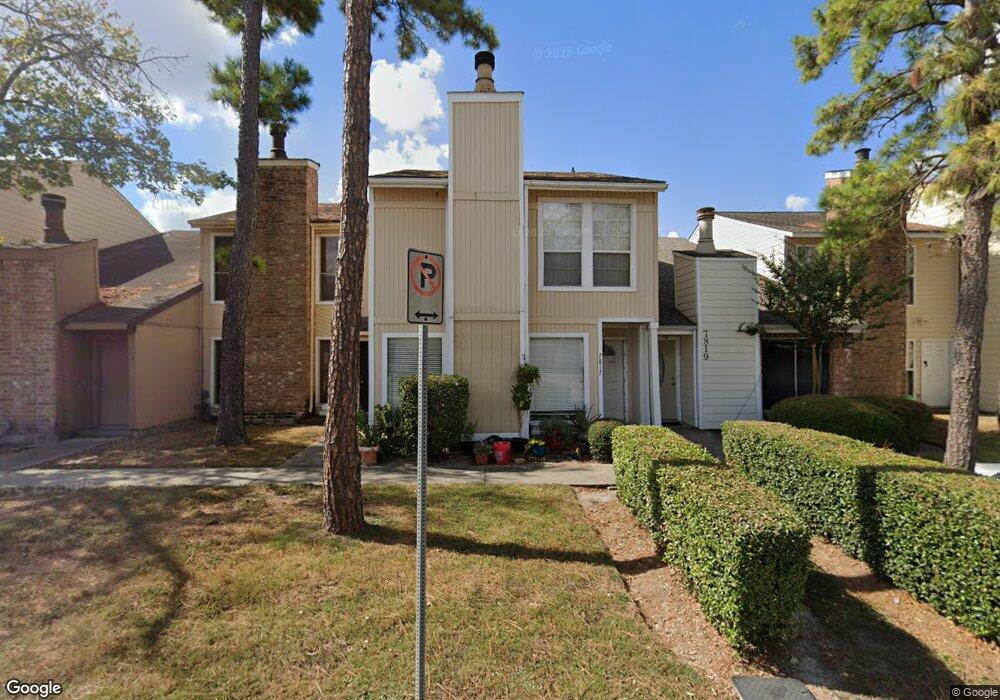
7817 Challie Ln Unit 7817 Houston, TX 77088
Greater Inwood NeighborhoodEstimated Value: $155,000 - $165,000
3
Beds
3
Baths
1,116
Sq Ft
$143/Sq Ft
Est. Value
About This Home
This home is located at 7817 Challie Ln Unit 7817, Houston, TX 77088 and is currently estimated at $159,760, approximately $143 per square foot. 7817 Challie Ln Unit 7817 is a home located in Harris County with nearby schools including Edward a Vines EC/Pre-K/K School, J. Ruth Smith Elementary, and Hoffman Middle School.
Ownership History
Date
Name
Owned For
Owner Type
Purchase Details
Closed on
Jan 30, 2006
Sold by
Young Jenny B
Bought by
Pena Claudia
Current Estimated Value
Home Financials for this Owner
Home Financials are based on the most recent Mortgage that was taken out on this home.
Original Mortgage
$86,000
Outstanding Balance
$48,529
Interest Rate
6.24%
Mortgage Type
Fannie Mae Freddie Mac
Estimated Equity
$111,231
Purchase Details
Closed on
Oct 18, 1999
Sold by
Meyer Rebecca A
Bought by
Bonner Johnny Lee and Bonner Santa T
Home Financials for this Owner
Home Financials are based on the most recent Mortgage that was taken out on this home.
Original Mortgage
$59,900
Interest Rate
7.9%
Mortgage Type
Purchase Money Mortgage
Purchase Details
Closed on
Mar 17, 1997
Sold by
Inwood Homeowners Assn
Bought by
Meyer Rebecca A
Purchase Details
Closed on
Oct 4, 1994
Sold by
Burnett Richard and Burnett Bennie
Bought by
Meyer Rebecca A
Home Financials for this Owner
Home Financials are based on the most recent Mortgage that was taken out on this home.
Original Mortgage
$30,000
Interest Rate
8.5%
Mortgage Type
Purchase Money Mortgage
Create a Home Valuation Report for This Property
The Home Valuation Report is an in-depth analysis detailing your home's value as well as a comparison with similar homes in the area
Home Values in the Area
Average Home Value in this Area
Purchase History
| Date | Buyer | Sale Price | Title Company |
|---|---|---|---|
| Pena Claudia | -- | Chicago Title | |
| Bonner Johnny Lee | -- | First American Title | |
| Meyer Rebecca A | -- | -- | |
| Meyer Rebecca A | -- | Regency Title |
Source: Public Records
Mortgage History
| Date | Status | Borrower | Loan Amount |
|---|---|---|---|
| Open | Pena Claudia | $86,000 | |
| Previous Owner | Bonner Johnny Lee | $59,900 | |
| Previous Owner | Meyer Rebecca A | $30,000 |
Source: Public Records
Tax History Compared to Growth
Tax History
| Year | Tax Paid | Tax Assessment Tax Assessment Total Assessment is a certain percentage of the fair market value that is determined by local assessors to be the total taxable value of land and additions on the property. | Land | Improvement |
|---|---|---|---|---|
| 2025 | $1,434 | $156,107 | $29,853 | $126,254 |
| 2024 | $1,434 | $160,645 | $29,853 | $130,792 |
| 2023 | $1,434 | $160,645 | $29,853 | $130,792 |
| 2022 | $2,543 | $150,000 | $23,882 | $126,118 |
| 2021 | $2,415 | $133,178 | $11,941 | $121,237 |
| 2020 | $2,301 | $98,468 | $11,941 | $86,527 |
| 2019 | $2,183 | $86,084 | $11,941 | $74,143 |
| 2018 | $624 | $68,444 | $11,941 | $56,503 |
| 2017 | $1,934 | $70,660 | $11,941 | $58,719 |
| 2016 | $1,758 | $63,123 | $11,941 | $51,182 |
| 2015 | $1,612 | $63,123 | $11,941 | $51,182 |
| 2014 | $1,612 | $57,725 | $11,941 | $45,784 |
Source: Public Records
Map
Nearby Homes
- 7840 Bateman Ln Unit 7840
- 7736 Challie Ln
- 7728 Challie Ln
- 7750 Green Lawn Dr
- 7868 Green Lawn Dr Unit 7868
- 7727 Green Lawn Dr
- 0 Antoine Dr
- 6011 Green Falls Dr
- 5914 Lawn Ln
- 5906 Lawn Ln
- 7402 Alabonson Rd Unit 506
- 7402 Alabonson Rd Unit 309
- 7402 Alabonson Rd Unit 510
- 7402 Alabonson Rd Unit 108
- 5639 Council Grove Ln
- 5710 Council Grove Ln
- 6303 Greenway Forest Ln
- 5519 Council Grove Ln
- 5611 Water Leaf Ln
- 5606 Water Leaf Ln
- 7815 Challie Ln Unit 7815
- 7819 Challie Ln Unit 7819
- 7813 Challie Ln Unit 7813
- 7821 Challie Ln Unit 7821
- 7811 Challie Ln Unit 7811
- 7823 Challie Ln Unit 7823
- 7809 Challie Ln Unit 7809
- 7825 Challie Ln Unit 7825
- 7827 Challie Ln Unit 7827
- 7805 Challie Ln Unit 7805
- 7840 Bateman Ln Unit 1
- 7803 Challie Ln Unit 7803
- 7838 Bateman Ln Unit 7838
- 7740 Challie Ln Unit 7740
- 7738 Challie Ln Unit 7738
- 7838 Challie Ln
- 7840 Challie Ln
- 7736 Challie Ln Unit 7736
- 7842 Challie Ln
- 5927 Arncliffe Dr Unit 5927