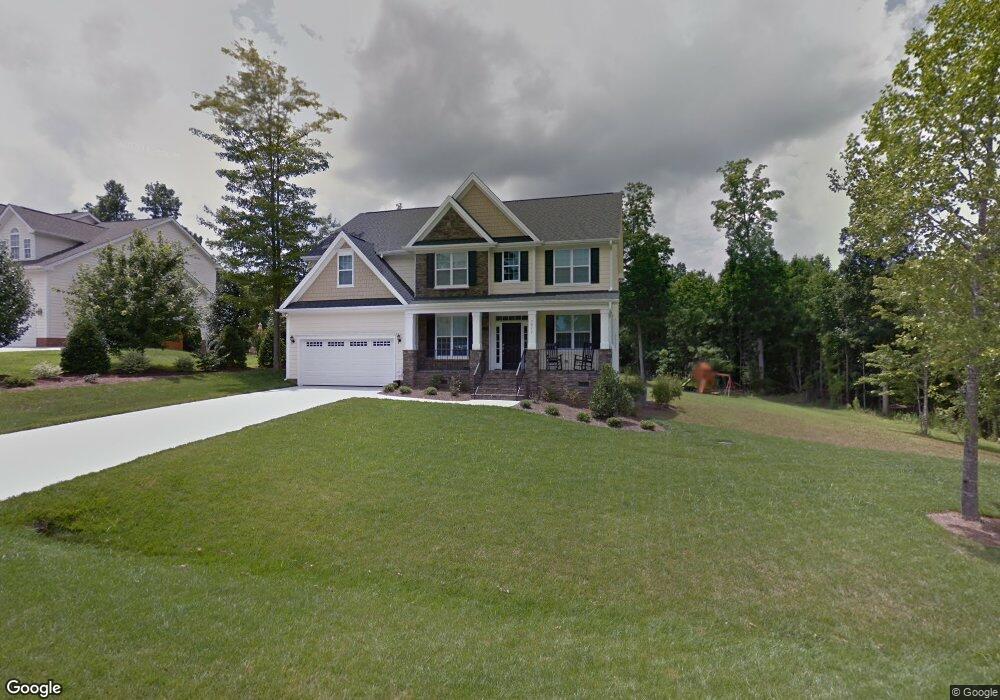
7817 Kensington Manor Ln Unit 49 Wake Forest, NC 27587
Falls Lake NeighborhoodEstimated Value: $681,789 - $833,000
--
Bed
--
Bath
3,154
Sq Ft
$245/Sq Ft
Est. Value
About This Home
This home is located at 7817 Kensington Manor Ln Unit 49, Wake Forest, NC 27587 and is currently estimated at $771,697, approximately $244 per square foot. 7817 Kensington Manor Ln Unit 49 is a home located in Wake County with nearby schools including North Forest Pines Elementary School, Wake Forest-Rolesville Middle School, and Wake Forest High School.
Ownership History
Date
Name
Owned For
Owner Type
Purchase Details
Closed on
Feb 15, 2013
Sold by
Psc Homes Llc
Bought by
Farrell Christian and Farrell Debra M
Current Estimated Value
Home Financials for this Owner
Home Financials are based on the most recent Mortgage that was taken out on this home.
Original Mortgage
$281,160
Outstanding Balance
$196,000
Interest Rate
3.35%
Mortgage Type
New Conventional
Estimated Equity
$575,697
Purchase Details
Closed on
Jul 20, 2012
Sold by
Spencer Tony G and Spencer Cynthia D
Bought by
Pcs Homes Llc
Purchase Details
Closed on
Feb 11, 2005
Sold by
Jenkins Road Llc
Bought by
First Premier Properties Llc
Home Financials for this Owner
Home Financials are based on the most recent Mortgage that was taken out on this home.
Original Mortgage
$2,650,000
Interest Rate
5.69%
Mortgage Type
Purchase Money Mortgage
Create a Home Valuation Report for This Property
The Home Valuation Report is an in-depth analysis detailing your home's value as well as a comparison with similar homes in the area
Home Values in the Area
Average Home Value in this Area
Purchase History
| Date | Buyer | Sale Price | Title Company |
|---|---|---|---|
| Farrell Christian | $351,500 | None Available | |
| Pcs Homes Llc | $45,000 | None Available | |
| First Premier Properties Llc | $3,340,000 | -- |
Source: Public Records
Mortgage History
| Date | Status | Borrower | Loan Amount |
|---|---|---|---|
| Open | Farrell Christian | $281,160 | |
| Previous Owner | First Premier Properties Llc | $2,650,000 |
Source: Public Records
Tax History Compared to Growth
Tax History
| Year | Tax Paid | Tax Assessment Tax Assessment Total Assessment is a certain percentage of the fair market value that is determined by local assessors to be the total taxable value of land and additions on the property. | Land | Improvement |
|---|---|---|---|---|
| 2025 | $4,019 | $625,305 | $120,000 | $505,305 |
| 2024 | $3,903 | $625,305 | $120,000 | $505,305 |
| 2023 | $3,013 | $383,838 | $55,000 | $328,838 |
| 2022 | $2,792 | $383,838 | $55,000 | $328,838 |
| 2021 | $2,717 | $383,838 | $55,000 | $328,838 |
| 2020 | $2,672 | $383,838 | $55,000 | $328,838 |
| 2019 | $3,089 | $375,732 | $80,000 | $295,732 |
| 2018 | $2,839 | $375,732 | $80,000 | $295,732 |
| 2017 | $2,691 | $375,732 | $80,000 | $295,732 |
| 2016 | $2,637 | $375,732 | $80,000 | $295,732 |
| 2015 | $2,738 | $391,401 | $106,000 | $285,401 |
| 2014 | $2,480 | $373,861 | $106,000 | $267,861 |
Source: Public Records
Map
Nearby Homes
- 2425 Welsh Tavern Way
- 2420 Mollynick Ln
- 8133 Holly Forest Rd
- 2637 Trifle Ln
- 7636 Matherly Dr
- 8022 Hogan Dr
- 2040 Pleasant Forest Way
- 8912 Thompson Mill Rd
- 8916 Thompson Mill Rd
- 8920 Thompson Mill Rd
- 2728 Trifle Ln
- 7317 Wexford Woods Ln
- 8704 Kimalden Ct
- 2809 Elsbeth Ct
- 3217 Donlin Dr
- 8621 Kimillie Ct
- 8000 Wexford Waters Ln
- 7961 Wexford Waters Ln
- 7824 Ailesbury Rd
- 8008 Wexford Waters Ln
- 7817 Kensington Manor Ln
- 7813 Kensington Manor Ln
- 7820 Kensington Manor Ln
- 7809 Kensington Manor Ln
- 7824 Kensington Manor Ln
- 7833 Kensington Manor Ln
- 7833 Kensington Manor Ln Unit 48
- 2709 Laurel Field Cir
- 7805 Kensington Manor Ln
- 7808 Kensington Manor Ln
- 8016 Debenham Dr
- 8000 Shorrey Place
- 8020 Debenham Dr
- 8012 Debenham Dr
- 2704 Laurel Field Cir
- 7801 Kensington Manor Ln
- 2705 Laurel Field Cir
- 8001 Shorrey Place
- 2700 Laurel Field Cir
- 8008 Debenham Dr