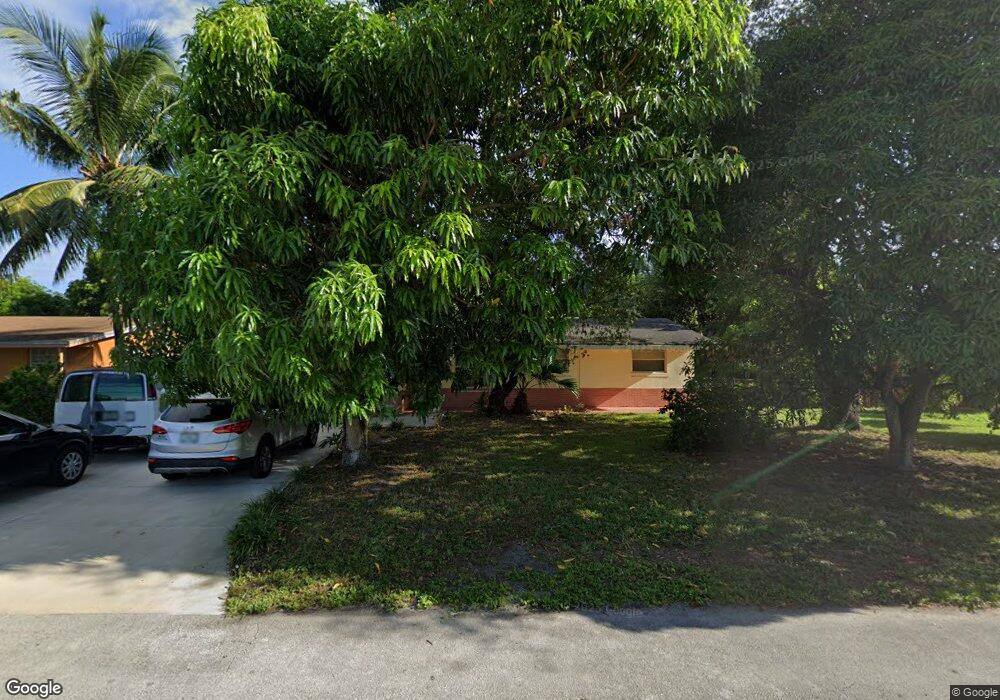
7817 Plantation Blvd Miramar, FL 33023
Miramar Tropical NeighborhoodEstimated Value: $466,828 - $547,000
3
Beds
2
Baths
1,373
Sq Ft
$368/Sq Ft
Est. Value
About This Home
This home is located at 7817 Plantation Blvd, Miramar, FL 33023 and is currently estimated at $505,207, approximately $367 per square foot. 7817 Plantation Blvd is a home located in Broward County with nearby schools including Sunshine Elementary School, New Renaissance Middle School, and Miramar High School.
Ownership History
Date
Name
Owned For
Owner Type
Purchase Details
Closed on
Jun 4, 2024
Sold by
Billings Basil Anthony and Billings Denise
Bought by
Billings Basil Anthony and Billings Denise
Current Estimated Value
Purchase Details
Closed on
Oct 20, 2005
Sold by
Billings Denise and Billings Basil Anthoby
Bought by
Billings Basil Anthony and Billings Denise
Home Financials for this Owner
Home Financials are based on the most recent Mortgage that was taken out on this home.
Original Mortgage
$215,000
Interest Rate
6.18%
Mortgage Type
Fannie Mae Freddie Mac
Purchase Details
Closed on
Mar 19, 2003
Sold by
Thompson Bruce and Thompson Denise
Bought by
Thompson Denise
Purchase Details
Closed on
Aug 31, 1995
Sold by
Eberly Cheri and Eberly Cheri L
Bought by
Thompson Bruce and Thompson Denise
Home Financials for this Owner
Home Financials are based on the most recent Mortgage that was taken out on this home.
Original Mortgage
$90,400
Interest Rate
7.76%
Mortgage Type
FHA
Create a Home Valuation Report for This Property
The Home Valuation Report is an in-depth analysis detailing your home's value as well as a comparison with similar homes in the area
Home Values in the Area
Average Home Value in this Area
Purchase History
| Date | Buyer | Sale Price | Title Company |
|---|---|---|---|
| Billings Basil Anthony | -- | Title365 | |
| Billings Basil Anthony | $107,500 | Garden Home Title | |
| Thompson Denise | -- | -- | |
| Thompson Bruce | $89,500 | -- |
Source: Public Records
Mortgage History
| Date | Status | Borrower | Loan Amount |
|---|---|---|---|
| Previous Owner | Billings Basil Anthony | $215,000 | |
| Previous Owner | Thompson Bruce | $90,400 |
Source: Public Records
Tax History Compared to Growth
Tax History
| Year | Tax Paid | Tax Assessment Tax Assessment Total Assessment is a certain percentage of the fair market value that is determined by local assessors to be the total taxable value of land and additions on the property. | Land | Improvement |
|---|---|---|---|---|
| 2025 | $2,431 | $137,180 | -- | -- |
| 2024 | $2,370 | $133,320 | -- | -- |
| 2023 | $2,370 | $129,440 | $0 | $0 |
| 2022 | $2,135 | $124,160 | $0 | $0 |
| 2021 | $2,081 | $120,550 | $0 | $0 |
| 2020 | $2,054 | $118,890 | $0 | $0 |
| 2019 | $2,023 | $116,220 | $0 | $0 |
| 2018 | $1,933 | $114,060 | $0 | $0 |
| 2017 | $1,852 | $111,720 | $0 | $0 |
| 2016 | $1,839 | $109,430 | $0 | $0 |
| 2015 | $1,815 | $108,670 | $0 | $0 |
| 2014 | $1,766 | $107,810 | $0 | $0 |
| 2013 | -- | $109,410 | $45,000 | $64,410 |
Source: Public Records
Map
Nearby Homes
- 7820 Orleans St
- 7740 Shalimar St
- 2401 Largo Dr
- 7917 Tropicana St
- 2340 Jamaica Dr
- 7952 Shalimar St
- 2270 Havana Dr
- 2410 Riviera Dr
- 7969 Ramona St
- 2110 Gulfstream Dr
- 7928 Miramar Blvd
- 7804 Meridian St
- 2431 Sabal Palm Dr
- 2261 Utopia Dr
- 7655 Tropicana St
- 7932 Meridian St
- 2506 Havana Dr
- 7612 Plantation Blvd
- 7642 Venetian St
- 2310 Flamingo Dr
- 7821 Plantation Blvd
- 7809 Plantation Blvd
- 7816 Ramona St
- 7820 Ramona St
- 7825 Plantation Blvd
- 7808 Ramona St
- 7816 Plantation Blvd
- 7812 Plantation Blvd
- 7805 Plantation Blvd
- 7820 Plantation Blvd
- 7824 Ramona St
- 7808 Plantation Blvd
- 7829 Plantation Blvd
- 7804 Ramona St
- 7824 Plantation Blvd
- 7828 Ramona St
- 7804 Plantation Blvd
- 7801 Plantation Blvd
- 7828 Plantation Blvd
- 7800 Ramona St