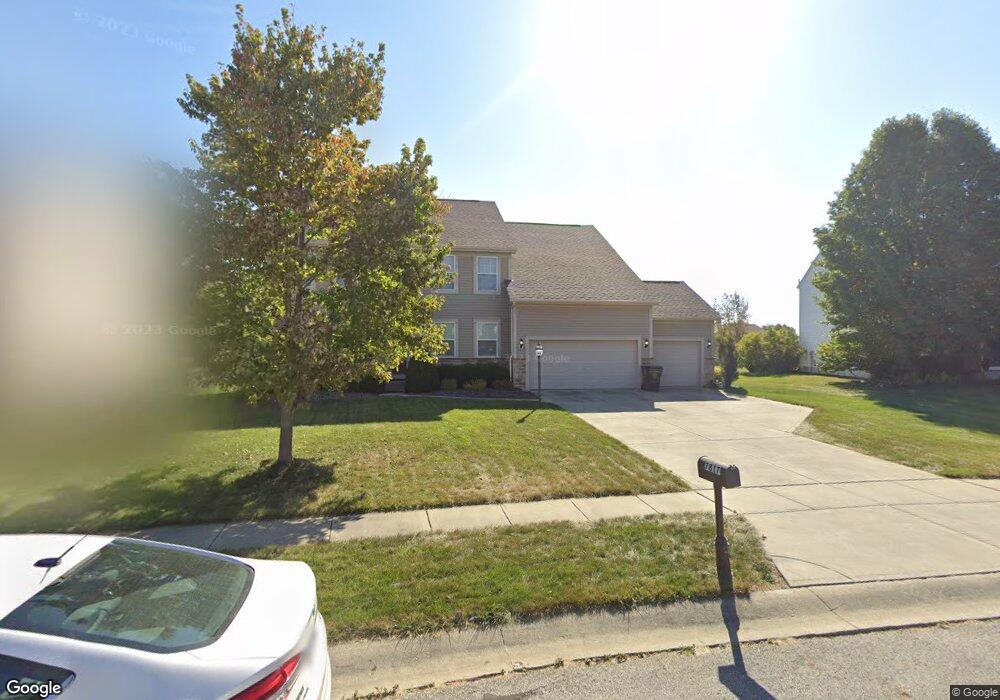
7817 Shady Maple Dr Canal Winchester, OH 43110
Estimated Value: $475,149 - $535,000
3
Beds
3
Baths
2,779
Sq Ft
$179/Sq Ft
Est. Value
About This Home
This home is located at 7817 Shady Maple Dr, Canal Winchester, OH 43110 and is currently estimated at $496,787, approximately $178 per square foot. 7817 Shady Maple Dr is a home located in Fairfield County with nearby schools including Sycamore Creek Elementary School, Pickerington Ridgeview Junior High School, and Diley Middle School.
Ownership History
Date
Name
Owned For
Owner Type
Purchase Details
Closed on
Jun 30, 2010
Sold by
Jackson William E and Jackson Vicki L
Bought by
Osborne Bradley and Osborne Lisa
Current Estimated Value
Home Financials for this Owner
Home Financials are based on the most recent Mortgage that was taken out on this home.
Original Mortgage
$177,500
Outstanding Balance
$118,246
Interest Rate
4.77%
Mortgage Type
New Conventional
Estimated Equity
$378,541
Purchase Details
Closed on
Aug 23, 2007
Sold by
Diyanni Brothers Inc
Bought by
Jackson William E and Jackson Vicki L
Home Financials for this Owner
Home Financials are based on the most recent Mortgage that was taken out on this home.
Original Mortgage
$292,469
Outstanding Balance
$186,403
Interest Rate
6.79%
Mortgage Type
Purchase Money Mortgage
Estimated Equity
$310,384
Purchase Details
Closed on
Jun 30, 2005
Sold by
S & D Real Estate Investment Co Ltd
Bought by
Diyanni Brothers Inc
Create a Home Valuation Report for This Property
The Home Valuation Report is an in-depth analysis detailing your home's value as well as a comparison with similar homes in the area
Home Values in the Area
Average Home Value in this Area
Purchase History
| Date | Buyer | Sale Price | Title Company |
|---|---|---|---|
| Osborne Bradley | $222,500 | Talon Title | |
| Jackson William E | $301,600 | Valmer Land Title Agency | |
| Diyanni Brothers Inc | -- | Valmerland Title Agency |
Source: Public Records
Mortgage History
| Date | Status | Borrower | Loan Amount |
|---|---|---|---|
| Open | Osborne Bradley | $177,500 | |
| Open | Jackson William E | $292,469 |
Source: Public Records
Tax History Compared to Growth
Tax History
| Year | Tax Paid | Tax Assessment Tax Assessment Total Assessment is a certain percentage of the fair market value that is determined by local assessors to be the total taxable value of land and additions on the property. | Land | Improvement |
|---|---|---|---|---|
| 2024 | $13,630 | $115,020 | $18,070 | $96,950 |
| 2023 | $5,233 | $115,020 | $18,070 | $96,950 |
| 2022 | $5,249 | $115,020 | $18,070 | $96,950 |
| 2021 | $5,333 | $99,540 | $18,070 | $81,470 |
| 2020 | $5,391 | $99,540 | $18,070 | $81,470 |
| 2019 | $5,426 | $99,540 | $18,070 | $81,470 |
| 2018 | $5,433 | $87,070 | $18,070 | $69,000 |
| 2017 | $5,441 | $87,070 | $18,070 | $69,000 |
| 2016 | $5,410 | $87,070 | $18,070 | $69,000 |
| 2015 | $5,384 | $83,970 | $18,070 | $65,900 |
| 2014 | $5,315 | $83,970 | $18,070 | $65,900 |
| 2013 | $5,315 | $83,970 | $18,070 | $65,900 |
Source: Public Records
Map
Nearby Homes
- 9068 Cresent View Dr NW
- 9068 Crescent View Dr
- 9121 Crescent View Dr
- Birmingham Plan at South Hampton
- Rockford Plan at South Hampton
- Valencia Plan at South Hampton
- Austin Plan at South Hampton
- Abington Plan at South Hampton
- Irving Plan at South Hampton
- Carlisle Plan at South Hampton
- Chattanooga Plan at South Hampton
- Glendale Plan at South Hampton
- Somerset Plan at South Hampton
- Sanibel Plan at South Hampton
- Avalon Plan at South Hampton
- Miramar Plan at South Hampton
- Iris with Full Basement Plan at Greengate Cove
- Marigold with Full Basement Plan at Greengate Cove
- Lily with Full Basement Plan at Greengate Cove
- Yosemite Plan at Sycamore Springs - Maple Street Collection
- 7833 Shady Maple Dr
- 7809 Shady Maple Dr
- 8063 Amanda Northern Rd NW
- 7840 Shady Maple Dr
- 7851 Shady Maple Dr
- 8041 Amanda Northern Rd NW
- 8835 Shady Woods St
- 7867 Shady Maple Dr
- 7867 Shady Maple Dr Unit Woodstream
- 8104 Amanda Northern Rd NW
- 7878 Shady Maple Dr
- 8863 Shady Woods St
- 8086 Amanda Northern Rd NW
- 8078 Amanda Northern Rd NW
- 7883 Shady Maple Dr
- 7890 Shady Maple Dr
- 8054 Amanda Northern Rd NW
- 8021 Woodstream Dr
- 8026 Woodstream Dr
- 8879 Shady Woods St NW