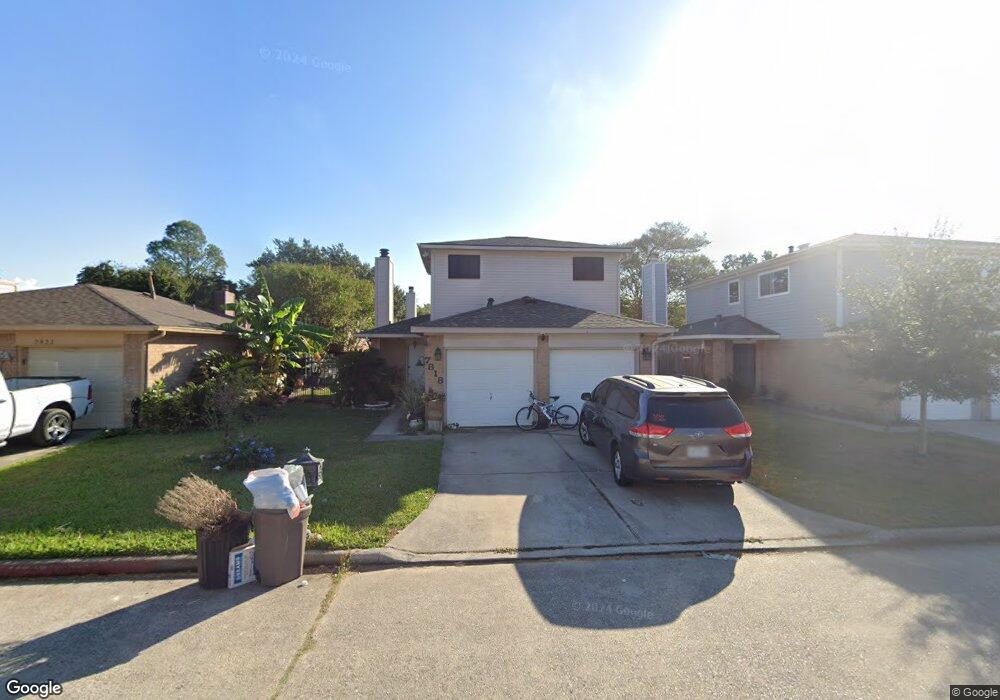
7818 Gatehouse Dr Houston, TX 77040
North Houston NeighborhoodEstimated Value: $178,000 - $205,000
2
Beds
3
Baths
1,162
Sq Ft
$166/Sq Ft
Est. Value
About This Home
This home is located at 7818 Gatehouse Dr, Houston, TX 77040 and is currently estimated at $192,652, approximately $165 per square foot. 7818 Gatehouse Dr is a home located in Harris County with nearby schools including Reed Elementary School, Dean Middle School, and Jersey Village High School.
Ownership History
Date
Name
Owned For
Owner Type
Purchase Details
Closed on
Apr 9, 2021
Sold by
Omoira Moran Shannon M and Omoira Moran Cheryl
Bought by
Lopez Alexander and Rivas Edgardo Lopez
Current Estimated Value
Home Financials for this Owner
Home Financials are based on the most recent Mortgage that was taken out on this home.
Original Mortgage
$128,250
Outstanding Balance
$115,607
Interest Rate
2.9%
Mortgage Type
New Conventional
Estimated Equity
$77,045
Purchase Details
Closed on
Mar 29, 2016
Sold by
Moran Shannon M O and Stone Shannon Archie
Bought by
Moira Shannon M O and Moran Shannon
Home Financials for this Owner
Home Financials are based on the most recent Mortgage that was taken out on this home.
Original Mortgage
$51,096
Interest Rate
3.65%
Mortgage Type
Purchase Money Mortgage
Create a Home Valuation Report for This Property
The Home Valuation Report is an in-depth analysis detailing your home's value as well as a comparison with similar homes in the area
Home Values in the Area
Average Home Value in this Area
Purchase History
| Date | Buyer | Sale Price | Title Company |
|---|---|---|---|
| Lopez Alexander | -- | None Available | |
| Moira Shannon M O | -- | None Available |
Source: Public Records
Mortgage History
| Date | Status | Borrower | Loan Amount |
|---|---|---|---|
| Open | Lopez Alexander | $128,250 | |
| Previous Owner | Moira Shannon M O | $51,096 |
Source: Public Records
Tax History Compared to Growth
Tax History
| Year | Tax Paid | Tax Assessment Tax Assessment Total Assessment is a certain percentage of the fair market value that is determined by local assessors to be the total taxable value of land and additions on the property. | Land | Improvement |
|---|---|---|---|---|
| 2025 | $4,314 | $193,935 | $44,278 | $149,657 |
| 2024 | $4,314 | $193,935 | $38,514 | $155,421 |
| 2023 | $4,314 | $201,132 | $38,514 | $162,618 |
| 2022 | $3,795 | $159,247 | $32,095 | $127,152 |
| 2021 | $3,568 | $141,542 | $32,095 | $109,447 |
| 2020 | $3,492 | $133,733 | $22,925 | $110,808 |
| 2019 | $2,938 | $124,669 | $21,222 | $103,447 |
| 2018 | $1,653 | $114,774 | $21,222 | $93,552 |
| 2017 | $3,106 | $114,774 | $21,222 | $93,552 |
| 2016 | $2,503 | $92,482 | $14,148 | $78,334 |
| 2015 | $621 | $92,482 | $14,148 | $78,334 |
| 2014 | $621 | $81,284 | $11,790 | $69,494 |
Source: Public Records
Map
Nearby Homes
- 7823 Redlands Dr
- 7802 Percussion Place
- 8403 Cienna Dr
- 8715 Andante Dr
- 8126 Ivan Reid Dr
- 8111 Ivan Reid Dr
- 8315 Whisper Point Dr
- 8131 Debbie Gay Dr
- 7915 Corrian Park Cir
- 8315 Terrace Brook Dr
- 8418 Westnut Ln
- 8115 Oahu Ct
- 8202 Terrace Brook Dr
- 8006 Summer Trail Dr
- 7410 Wood Bluff Blvd
- 7714 Rolling Fork Ln
- 7926 Westington Ln
- 9118 Woodwind Lakes Dr
- 9315 Woodwind Lakes Dr
- 8331 Westbank Ave
- 7814 Gatehouse Dr
- 7822 Gatehouse Dr
- 7815 Mauvewood Dr
- 7811 Mauvewood Dr
- 7810 Gatehouse Dr
- 7826 Gatehouse Dr
- 7807 Mauvewood Dr
- 7823 Mauvewood Dr
- 7819 Gatehouse Dr
- 7815 Gatehouse Dr
- 7830 Gatehouse Dr
- 7823 Gatehouse Dr
- 7806 Gatehouse Dr
- 7811 Gatehouse Dr
- 7803 Mauvewood Dr
- 7827 Gatehouse Dr
- 7827 Mauvewood Dr
- 7807 Gatehouse Dr
- 7834 Gatehouse Dr
- 7831 Gatehouse Dr