7819 Battles Rd Gates Mills, OH 44040
Estimated Value: $489,000 - $602,000
4
Beds
3
Baths
2,485
Sq Ft
$222/Sq Ft
Est. Value
About This Home
This home is located at 7819 Battles Rd, Gates Mills, OH 44040 and is currently estimated at $551,511, approximately $221 per square foot. 7819 Battles Rd is a home located in Cuyahoga County with nearby schools including Mayfield High School and Hawken Upper School.
Ownership History
Date
Name
Owned For
Owner Type
Purchase Details
Closed on
Jun 23, 2011
Sold by
Fannie Mae
Bought by
Dipietro Basil and Dipietro Lucia
Current Estimated Value
Purchase Details
Closed on
Jan 28, 2011
Sold by
Hunter Dana Christina
Bought by
Federal National Mortgage Association
Purchase Details
Closed on
Mar 8, 2001
Sold by
Hunter Sharon A
Bought by
Hunter Jeffrey T and Hunter Sharon A
Purchase Details
Closed on
Jul 15, 1993
Sold by
Hunter Jeffrey T
Bought by
Hunter Sharon A
Purchase Details
Closed on
Jan 28, 1992
Sold by
Hunter Sharon A
Bought by
Hunter Jeffrey T
Purchase Details
Closed on
Apr 25, 1991
Sold by
Hunter Jeffrey T
Bought by
Hunter Sharon A
Purchase Details
Closed on
Jul 1, 1987
Sold by
Molley Peter and Molley Eleanor
Bought by
Hunter Jeffrey T
Purchase Details
Closed on
Jan 1, 1975
Bought by
Molley Peter and Molley Eleanor
Create a Home Valuation Report for This Property
The Home Valuation Report is an in-depth analysis detailing your home's value as well as a comparison with similar homes in the area
Home Values in the Area
Average Home Value in this Area
Purchase History
| Date | Buyer | Sale Price | Title Company |
|---|---|---|---|
| Dipietro Basil | $190,000 | Allodial | |
| Federal National Mortgage Association | -- | Attorney | |
| Hunter Jeffrey T | -- | -- | |
| Hunter Sharon A | -- | -- | |
| Hunter Jeffrey T | -- | -- | |
| Hunter Sharon A | -- | -- | |
| Hunter Jeffrey T | $154,200 | -- | |
| Molley Peter | -- | -- |
Source: Public Records
Tax History Compared to Growth
Tax History
| Year | Tax Paid | Tax Assessment Tax Assessment Total Assessment is a certain percentage of the fair market value that is determined by local assessors to be the total taxable value of land and additions on the property. | Land | Improvement |
|---|---|---|---|---|
| 2024 | $11,203 | $170,660 | $58,135 | $112,525 |
| 2023 | $9,067 | $121,210 | $40,670 | $80,540 |
| 2022 | $9,007 | $121,210 | $40,670 | $80,540 |
| 2021 | $8,920 | $121,210 | $40,670 | $80,540 |
| 2020 | $8,568 | $117,670 | $39,480 | $78,190 |
| 2019 | $8,281 | $336,200 | $112,800 | $223,400 |
| 2018 | $9,307 | $117,670 | $39,480 | $78,190 |
| 2017 | $8,883 | $105,110 | $38,500 | $66,610 |
| 2016 | $8,818 | $105,110 | $38,500 | $66,610 |
| 2015 | $7,891 | $105,110 | $38,500 | $66,610 |
| 2014 | $7,891 | $100,100 | $36,680 | $63,420 |
Source: Public Records
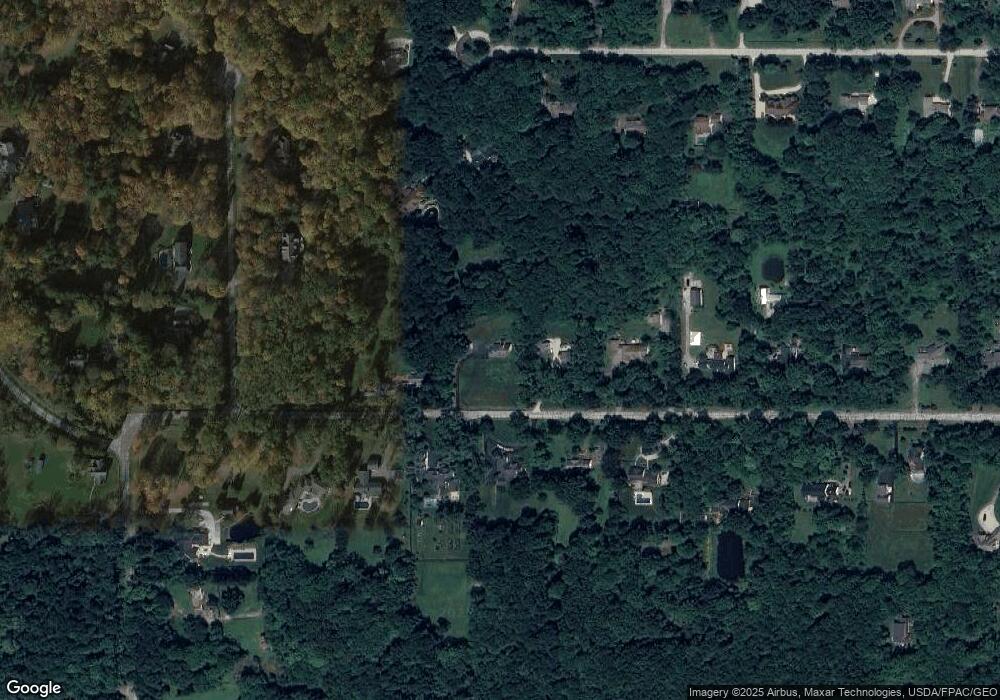
Map
Nearby Homes
- 7840 Gates Mills Estate Dr
- 560 County Line Rd
- 7959 Gates Mills Estates
- 630 Battles Rd
- 11240 W Walnut Ridge Rd
- 781 Chagrin River Rd
- 920 Chestnut Run
- 2925 Mill Gate Dr
- 769 Village Trail
- 704 Echo Dr
- 860 W Hill Dr
- 780 Village Cir
- 654 Robley Ln
- 710 Robley Ln
- 11925 Caves Rd
- 800 Hardwood Ct
- 12120 Caves Rd
- 38430 Chardon Rd
- 7454 Euclid Chardon Rd
- 2760 Loreto Dr
- 7839 Battles Rd
- 7820 Battles Rd
- 7779 Battles Rd
- 7859 Battles Rd
- 7800 Battles Rd
- 7840 Battles Rd
- 7780 Battles Rd
- 7860 Battles Rd
- 7799 Battles Rd
- 7820 Gates Mills Estates Dr
- 7820 Gates Mills Estate Dr
- 7840 Gates Mills Estates
- 469 Farm Dr
- 7760 Battles Rd
- 7860 Gates Mills Estate Dr
- 7880 Battles Rd
- 7899 Battles Rd
- 459 Hawthorne Farms
- 7880 Gates Mills Estate Dr
- 7800 Gates Mills Estate Dr