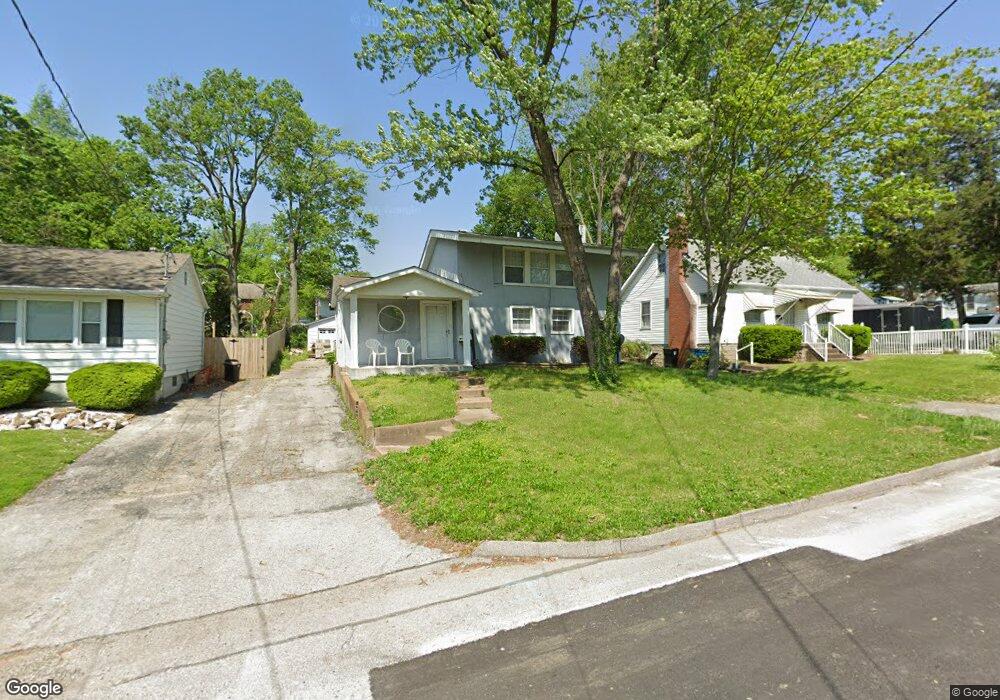
7819 Fleta St Saint Louis, MO 63123
Estimated Value: $147,885 - $184,000
2
Beds
1
Bath
974
Sq Ft
$173/Sq Ft
Est. Value
About This Home
This home is located at 7819 Fleta St, Saint Louis, MO 63123 and is currently estimated at $168,971, approximately $173 per square foot. 7819 Fleta St is a home located in St. Louis County with nearby schools including Mesnier Primary School, Gotsch Intermediate School, and Rogers Middle School.
Ownership History
Date
Name
Owned For
Owner Type
Purchase Details
Closed on
Feb 18, 2011
Sold by
Federal National Mortgage Association
Bought by
Nguyen Mary
Current Estimated Value
Purchase Details
Closed on
Jun 24, 2010
Sold by
Beck Amy
Bought by
Federal National Mortgage Association
Purchase Details
Closed on
Feb 15, 2007
Sold by
Rhomberg Kevin W and Rhomberg Donna
Bought by
Beck Amy
Home Financials for this Owner
Home Financials are based on the most recent Mortgage that was taken out on this home.
Original Mortgage
$91,580
Interest Rate
6.17%
Mortgage Type
Purchase Money Mortgage
Purchase Details
Closed on
May 27, 2003
Sold by
Hud
Bought by
Rhomberg Kevin W and Rhomberg Christopher
Purchase Details
Closed on
Feb 28, 2003
Sold by
Homeside Lending Inc
Bought by
Hud
Purchase Details
Closed on
Nov 14, 2002
Sold by
Watts Jean L and Watts Diane M
Bought by
Homeside Lending Inc
Create a Home Valuation Report for This Property
The Home Valuation Report is an in-depth analysis detailing your home's value as well as a comparison with similar homes in the area
Home Values in the Area
Average Home Value in this Area
Purchase History
| Date | Buyer | Sale Price | Title Company |
|---|---|---|---|
| Nguyen Mary | $31,500 | Mokan Title Services Llc | |
| Federal National Mortgage Association | $83,314 | Mokan | |
| Beck Amy | $96,400 | None Available | |
| Rhomberg Kevin W | -- | -- | |
| Hud | -- | -- | |
| Homeside Lending Inc | $47,936 | -- |
Source: Public Records
Mortgage History
| Date | Status | Borrower | Loan Amount |
|---|---|---|---|
| Previous Owner | Beck Amy | $91,580 |
Source: Public Records
Tax History Compared to Growth
Tax History
| Year | Tax Paid | Tax Assessment Tax Assessment Total Assessment is a certain percentage of the fair market value that is determined by local assessors to be the total taxable value of land and additions on the property. | Land | Improvement |
|---|---|---|---|---|
| 2025 | $2,032 | $26,350 | $14,740 | $11,610 |
| 2024 | $2,032 | $25,080 | $9,840 | $15,240 |
| 2023 | $1,965 | $25,080 | $9,840 | $15,240 |
| 2022 | $1,841 | $21,390 | $9,840 | $11,550 |
| 2021 | $1,798 | $21,390 | $9,840 | $11,550 |
| 2020 | $1,538 | $17,020 | $9,670 | $7,350 |
| 2019 | $1,535 | $17,020 | $9,670 | $7,350 |
| 2018 | $1,271 | $12,410 | $6,750 | $5,660 |
| 2017 | $1,263 | $12,410 | $6,750 | $5,660 |
| 2016 | $667 | $6,830 | $3,900 | $2,930 |
| 2015 | $670 | $6,830 | $3,900 | $2,930 |
| 2014 | $592 | $5,980 | $4,670 | $1,310 |
Source: Public Records
Map
Nearby Homes
- 7908 Fleta St
- 7743 Genesta St
- 7817 Clevedon St
- 5237 Heege Rd
- 5309 Staely Ave
- 8022 Joel Ave
- 8032 Joel Ave
- 8029 Joel Ave
- 5900 Apple Valley Dr
- 5615 Willard Ave
- 5331 Vine Ave
- 5311 Vine Ave
- 8211 Mathilda Ave
- 8019 Gramond Dr
- 5122 Hilda Ave
- 7917 Menola St
- 5114 Heege Rd
- 8027 McGee St
- 8305 Vasel Dr
- 8315 Maylor Dr
- 7821 Fleta St
- 7823 Fleta St
- 7818 Genesta St
- 63123 63123- 7 Home Package
- 7820 Genesta St
- 7816 Genesta St
- 7809 Fleta St
- 7827 Fleta St
- 7824 Genesta St
- 7812 Genesta St
- 7820 Fleta St
- 7810 Genesta St
- 7824 Fleta St
- 7816 Fleta St
- 7828 Genesta St
- 7833 Fleta St
- 7828 Fleta St
- 7814 Fleta St
- 7808 Genesta St
- 7830 Genesta St