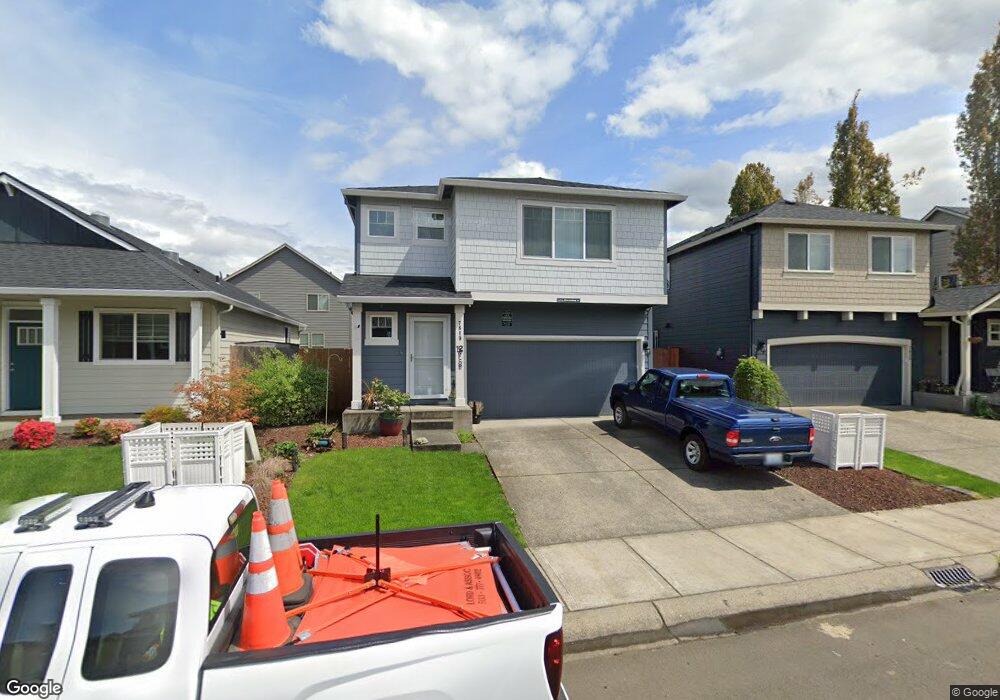
7819 NE 91st Ave Vancouver, WA 98662
Estimated Value: $488,000 - $527,000
4
Beds
3
Baths
1,806
Sq Ft
$278/Sq Ft
Est. Value
About This Home
This home is located at 7819 NE 91st Ave, Vancouver, WA 98662 and is currently estimated at $502,725, approximately $278 per square foot. 7819 NE 91st Ave is a home located in Clark County with nearby schools including Sunset Elementary School, Covington Middle School, and Heritage High School.
Ownership History
Date
Name
Owned For
Owner Type
Purchase Details
Closed on
May 15, 2017
Sold by
D R Horton Inc Portland
Bought by
Anderson Christine M and Anderson Mark C
Current Estimated Value
Home Financials for this Owner
Home Financials are based on the most recent Mortgage that was taken out on this home.
Original Mortgage
$291,546
Outstanding Balance
$240,093
Interest Rate
3.75%
Mortgage Type
FHA
Estimated Equity
$262,632
Purchase Details
Closed on
Feb 13, 2017
Sold by
Yang Julie
Bought by
D R Horton Inc Portland
Purchase Details
Closed on
Oct 25, 2016
Sold by
Clackamas Three Llc
Bought by
Yang Julie
Purchase Details
Closed on
Apr 16, 2015
Sold by
Apic Real Estate Development Llc
Bought by
Clackamas Three Llc
Purchase Details
Closed on
May 10, 2011
Sold by
Frontier Bank
Bought by
Union Bank Na
Purchase Details
Closed on
May 3, 2011
Sold by
Union Bank Na
Bought by
Apic Real Estate Development Llc
Purchase Details
Closed on
Sep 21, 2009
Sold by
Sound Built Homes Inc
Bought by
Frontier Bank
Create a Home Valuation Report for This Property
The Home Valuation Report is an in-depth analysis detailing your home's value as well as a comparison with similar homes in the area
Home Values in the Area
Average Home Value in this Area
Purchase History
| Date | Buyer | Sale Price | Title Company |
|---|---|---|---|
| Anderson Christine M | $296,925 | First Amer Title Vancouver | |
| D R Horton Inc Portland | $1,789,000 | Fidelity Title Dt Vancouver | |
| Yang Julie | $2,075,000 | Fidelity National Title | |
| Clackamas Three Llc | $2,420,000 | Columbia Title Agency | |
| Union Bank Na | -- | First American Title | |
| Apic Real Estate Development Llc | $1,431,685 | First American Title | |
| Frontier Bank | $8,543,091 | None Available |
Source: Public Records
Mortgage History
| Date | Status | Borrower | Loan Amount |
|---|---|---|---|
| Open | Anderson Christine M | $291,546 |
Source: Public Records
Tax History Compared to Growth
Tax History
| Year | Tax Paid | Tax Assessment Tax Assessment Total Assessment is a certain percentage of the fair market value that is determined by local assessors to be the total taxable value of land and additions on the property. | Land | Improvement |
|---|---|---|---|---|
| 2025 | $4,485 | $439,938 | $145,200 | $294,738 |
| 2024 | $4,159 | $441,281 | $145,200 | $296,081 |
| 2023 | $4,258 | $429,417 | $137,940 | $291,477 |
| 2022 | $3,878 | $433,120 | $145,200 | $287,920 |
| 2021 | $3,680 | $367,206 | $123,200 | $244,006 |
| 2020 | $3,443 | $327,815 | $110,000 | $217,815 |
| 2019 | $3,078 | $307,770 | $104,500 | $203,270 |
| 2018 | $3,385 | $296,776 | $0 | $0 |
| 2017 | $806 | $263,873 | $0 | $0 |
| 2016 | $732 | $62,500 | $0 | $0 |
| 2015 | $731 | $52,500 | $0 | $0 |
| 2014 | -- | $50,000 | $0 | $0 |
| 2013 | -- | $50,250 | $0 | $0 |
Source: Public Records
Map
Nearby Homes
- 9217 NE 81st Loop
- 8003 NE 87th Ave
- 8800 NE 82nd St
- 9604 NE 83rd Cir
- 9011 NE 89th Cir
- 7618 NE Meadows Dr
- 6906 NE 90th Ave
- 9006 NE 89th Cir
- 8615 NE 69th St
- 8305 NE 71st St
- 8406 NE 105th Ave
- 8111 NE 88th St
- 7817 NE 107th Ave
- 10418 NE 66th St
- 10703 NE 70th St
- 10507 NE 90th St
- 9610 NE 87th Ave
- 9714 NE 91st Ave
- 6214 NE 84th Ave
- 7501 NE 87th St
- 7819 NE 91st Ave Unit 63
- 7901 NE 91st Ave
- 7815 NE 91st Ave
- 7815 NE 91st Ave Unit Lot62
- 7816 NE 92nd Ave
- 7905 NE 91st Ave
- 7811 NE 91st Ave
- 7902 NE 92nd Ave Unit Lot47
- 7902 NE 92nd Ave
- 7906 NE 92nd Ave Unit Lot46
- 7906 NE 92nd Ave
- 7808 NE 92nd Ave
- 7814 NE 91st Ave
- 7807 NE 91st Ave
- 7818 NE 91st Ave
- 7910 NE 92nd Ave
- 7804 NE 92nd Ave
- 7900 NE 91st Ave
- 7900 NE 91st Ave Unit Lot77
- 7905 NE 61st Cir