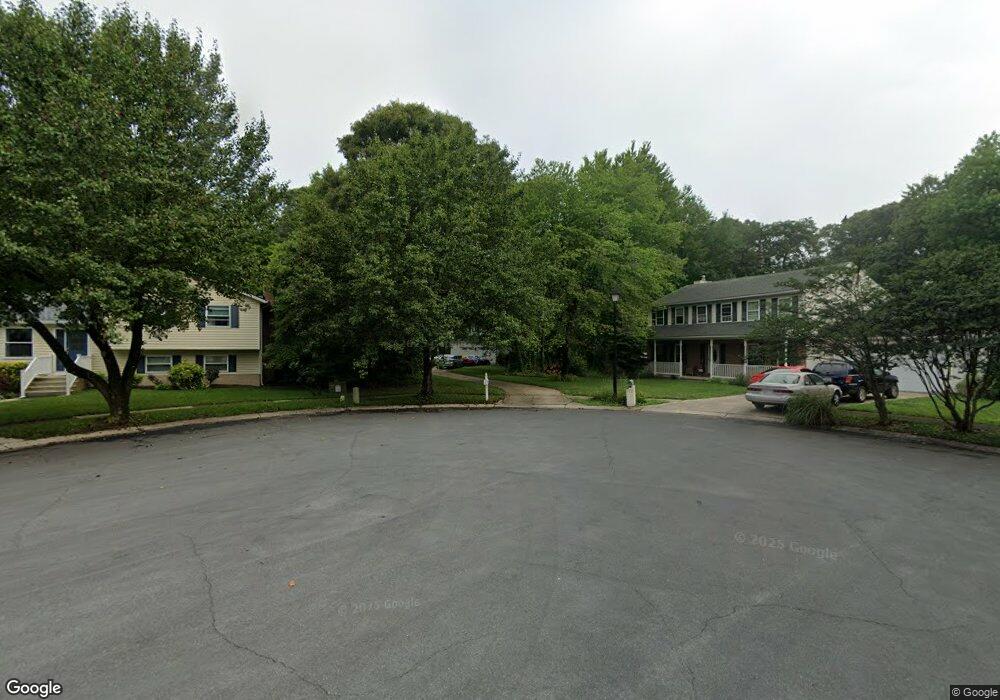
782 Cotswolde Quay Ct Severna Park, MD 21146
Estimated Value: $585,476 - $766,000
--
Bed
3
Baths
1,764
Sq Ft
$385/Sq Ft
Est. Value
About This Home
This home is located at 782 Cotswolde Quay Ct, Severna Park, MD 21146 and is currently estimated at $679,369, approximately $385 per square foot. 782 Cotswolde Quay Ct is a home located in Anne Arundel County with nearby schools including Jones Elementary School, Severna Park Middle School, and Severna Park High School.
Ownership History
Date
Name
Owned For
Owner Type
Purchase Details
Closed on
Aug 5, 2016
Bought by
Brinkerhoff Barbara
Current Estimated Value
Home Financials for this Owner
Home Financials are based on the most recent Mortgage that was taken out on this home.
Original Mortgage
$423,107
Outstanding Balance
$337,044
Interest Rate
3.43%
Estimated Equity
$342,325
Purchase Details
Closed on
Oct 6, 1995
Sold by
Keeler Kenneth
Bought by
Brinkerhoff Derek P
Home Financials for this Owner
Home Financials are based on the most recent Mortgage that was taken out on this home.
Original Mortgage
$159,200
Interest Rate
7.86%
Purchase Details
Closed on
Aug 13, 1986
Sold by
Davis Samuel T
Bought by
Keeler Kenneth
Home Financials for this Owner
Home Financials are based on the most recent Mortgage that was taken out on this home.
Original Mortgage
$112,110
Interest Rate
10.4%
Create a Home Valuation Report for This Property
The Home Valuation Report is an in-depth analysis detailing your home's value as well as a comparison with similar homes in the area
Home Values in the Area
Average Home Value in this Area
Purchase History
| Date | Buyer | Sale Price | Title Company |
|---|---|---|---|
| Brinkerhoff Barbara | -- | -- | |
| Brinkerhoff Derek P | $199,000 | -- | |
| Keeler Kenneth | $139,900 | -- |
Source: Public Records
Mortgage History
| Date | Status | Borrower | Loan Amount |
|---|---|---|---|
| Open | Brinkerhoff Derek P | $423,107 | |
| Closed | Brinkerhoff Derek P | -- | |
| Previous Owner | Brinkerhoff Derek P | $159,200 | |
| Previous Owner | Keeler Kenneth | $112,110 |
Source: Public Records
Tax History Compared to Growth
Tax History
| Year | Tax Paid | Tax Assessment Tax Assessment Total Assessment is a certain percentage of the fair market value that is determined by local assessors to be the total taxable value of land and additions on the property. | Land | Improvement |
|---|---|---|---|---|
| 2025 | $4,099 | $492,533 | -- | -- |
| 2024 | $4,099 | $471,100 | $293,900 | $177,200 |
| 2023 | $3,974 | $466,233 | $0 | $0 |
| 2022 | $3,735 | $461,367 | $0 | $0 |
| 2021 | $3,572 | $456,500 | $278,900 | $177,600 |
| 2020 | $3,572 | $443,833 | $0 | $0 |
| 2019 | $3,485 | $431,167 | $0 | $0 |
| 2018 | $3,330 | $418,500 | $226,900 | $191,600 |
| 2017 | $3,282 | $405,233 | $0 | $0 |
| 2016 | -- | $391,967 | $0 | $0 |
| 2015 | -- | $378,700 | $0 | $0 |
| 2014 | -- | $378,700 | $0 | $0 |
Source: Public Records
Map
Nearby Homes
- 0 Magothy Rd Unit 9G MDAA2101266
- 369 Magothy Rd Unit 12A
- 360 Magothy Rd Unit 5A
- 360 Magothy Rd Unit 4E
- 360 Magothy Rd Unit 2G
- 360 Magothy Rd Unit 1F
- 360 Magothy Rd Unit 8B
- 360 Magothy Rd Unit 3D
- 360 Magothy Rd Unit 13C
- 360 Magothy Rd Unit 5D
- 360 Magothy Rd Unit 5F
- 360 Magothy Rd Unit 6F
- 360 Magothy Rd Unit 9J
- 360 Magothy Rd Unit 8J
- 360 Magothy Rd Unit 26J
- 360 Magothy Rd Unit 27J
- 360 Magothy Rd Unit 6B
- 360 Magothy Rd Unit 2E
- 360 Magothy Rd Unit 7K
- 360 Magothy Rd Unit 8H
- 331 Gordon Ave
- 329 Gordon Ave
- 786 Cotswolde Quay Ct
- 333 Gordon Ave
- 327 Gordon Ave
- 788 Cotswolde Quay Ct
- 335 Gordon Ave
- 322 Raussell Place
- 320 Raussell Place
- 739 Mccann Rd
- 318 Raussell Place
- 324 Raussell Place
- 321 Gordon Ave
- 742 Mccann Rd
- 775 Cotswolde Quay Ct
- 334 Gordon Ave
- 742 Dividing Rd
- 316 Raussell Place
- 737 Mccann Rd
- 740 Mccann Rd