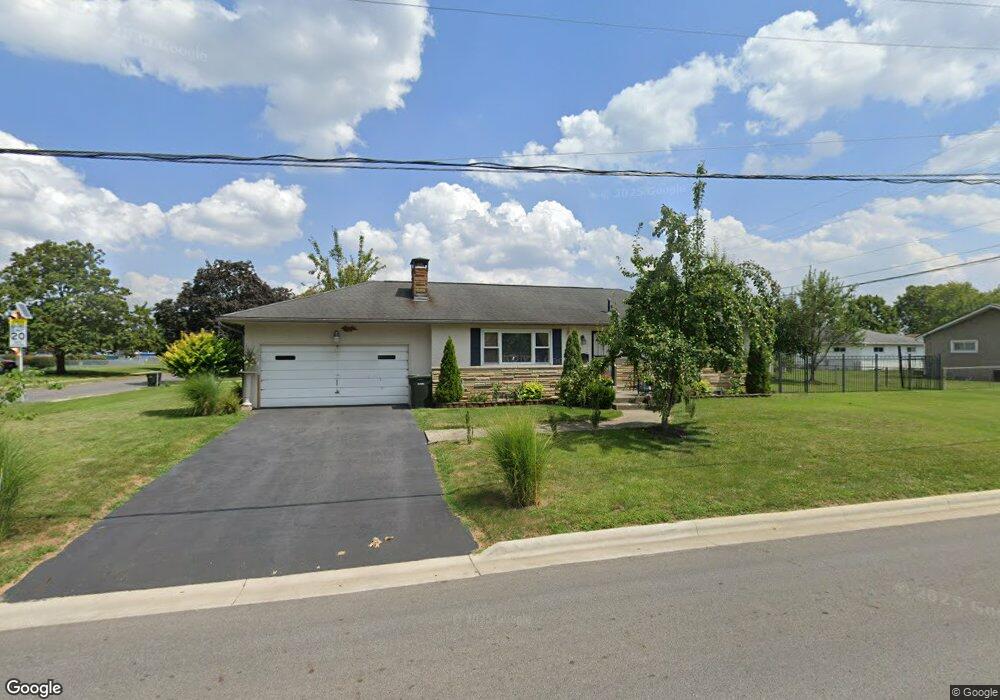
782 S Brinker Ave Columbus, OH 43204
Southwest Hilltop NeighborhoodEstimated Value: $173,000 - $229,000
3
Beds
2
Baths
1,118
Sq Ft
$191/Sq Ft
Est. Value
About This Home
This home is located at 782 S Brinker Ave, Columbus, OH 43204 and is currently estimated at $213,386, approximately $190 per square foot. 782 S Brinker Ave is a home located in Franklin County with nearby schools including Binns Elementary School, Wedgewood Middle School, and Briggs High School.
Ownership History
Date
Name
Owned For
Owner Type
Purchase Details
Closed on
Mar 9, 2011
Sold by
Citibank Na
Bought by
Leap Lim Chheng Y and Leap Maiy
Current Estimated Value
Purchase Details
Closed on
Aug 6, 2010
Sold by
Deutsche Bank National Trust Company
Bought by
Lim Chheng Y
Home Financials for this Owner
Home Financials are based on the most recent Mortgage that was taken out on this home.
Original Mortgage
$59,103
Interest Rate
4.4%
Mortgage Type
FHA
Purchase Details
Closed on
Mar 23, 2010
Sold by
Horn Russell L and Horn Veronica G
Bought by
Deutsche Bank National Trust Company
Purchase Details
Closed on
Jun 28, 1995
Sold by
Forbes Robert
Bought by
Horn Russell L and Horn Veronica A
Home Financials for this Owner
Home Financials are based on the most recent Mortgage that was taken out on this home.
Original Mortgage
$85,550
Interest Rate
7.88%
Mortgage Type
VA
Purchase Details
Closed on
Apr 25, 1994
Purchase Details
Closed on
Feb 25, 1994
Create a Home Valuation Report for This Property
The Home Valuation Report is an in-depth analysis detailing your home's value as well as a comparison with similar homes in the area
Home Values in the Area
Average Home Value in this Area
Purchase History
| Date | Buyer | Sale Price | Title Company |
|---|---|---|---|
| Leap Lim Chheng Y | $15,000 | Accutitle Agency Inc | |
| Lim Chheng Y | $59,900 | Accutitle Agency Inc | |
| Deutsche Bank National Trust Company | $76,000 | None Available | |
| Horn Russell L | $83,900 | -- | |
| -- | $75,000 | -- | |
| -- | -- | -- |
Source: Public Records
Mortgage History
| Date | Status | Borrower | Loan Amount |
|---|---|---|---|
| Previous Owner | Lim Chheng Y | $59,103 | |
| Previous Owner | Horn Russell L | $85,550 |
Source: Public Records
Tax History
| Year | Tax Paid | Tax Assessment Tax Assessment Total Assessment is a certain percentage of the fair market value that is determined by local assessors to be the total taxable value of land and additions on the property. | Land | Improvement |
|---|---|---|---|---|
| 2025 | $3,249 | $67,630 | $16,560 | $51,070 |
| 2024 | $3,249 | $67,630 | $16,560 | $51,070 |
| 2023 | $3,211 | $67,620 | $16,555 | $51,065 |
| 2022 | $2,633 | $46,730 | $10,260 | $36,470 |
| 2021 | $2,638 | $46,730 | $10,260 | $36,470 |
| 2020 | $2,642 | $46,730 | $10,260 | $36,470 |
| 2019 | $2,553 | $38,640 | $8,540 | $30,100 |
| 2018 | $2,128 | $38,640 | $8,540 | $30,100 |
| 2017 | $2,452 | $38,640 | $8,540 | $30,100 |
| 2016 | $1,869 | $26,780 | $6,230 | $20,550 |
| 2015 | $1,706 | $26,780 | $6,230 | $20,550 |
| 2014 | $1,660 | $26,780 | $6,230 | $20,550 |
| 2013 | $1,014 | $31,500 | $7,315 | $24,185 |
Source: Public Records
Map
Nearby Homes
- 840 Mark Place
- 814 Miriam Dr W
- 793 Binns Blvd
- 894 Binns Blvd
- 3318 Miriam Dr S
- 3340 Miriam Dr S
- 3029 Rosedale Ave
- 695 Demorest Rd
- 638 Binns Blvd
- 814 Chestershire Rd
- 642 S Roys Ave
- 733 S Hague Ave
- 3551 Glorious Rd
- 457 Guernsey Ave
- 3001 Wicklow Rd
- 857 Regina Ct
- 2835 Sullivant Ave
- 408 Derrer Rd
- 623 S Harris Ave
- 328 S Sylvan Ave
Your Personal Tour Guide
Ask me questions while you tour the home.