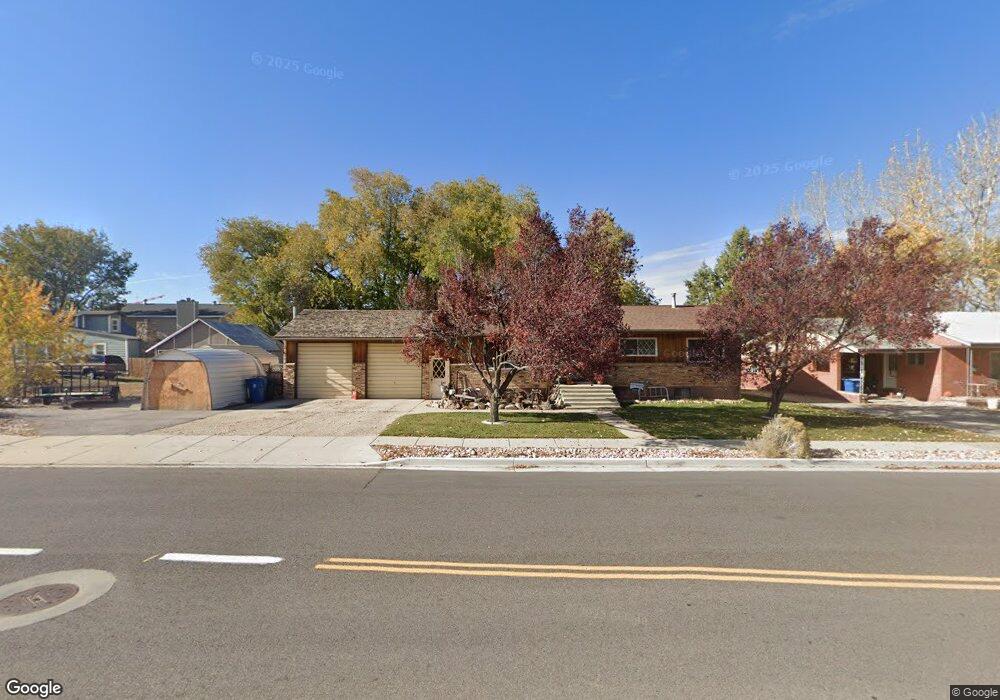
782 S Main St Payson, UT 84651
Estimated Value: $430,660 - $533,000
3
Beds
3
Baths
1,505
Sq Ft
$316/Sq Ft
Est. Value
About This Home
This home is located at 782 S Main St, Payson, UT 84651 and is currently estimated at $475,165, approximately $315 per square foot. 782 S Main St is a home located in Utah County with nearby schools including Park View Elementary, Payson High School, and Payson Junior High School.
Ownership History
Date
Name
Owned For
Owner Type
Purchase Details
Closed on
Mar 7, 2017
Sold by
Skabelund Steven R and Sanford Richard T
Bought by
Skabelund Steven R
Current Estimated Value
Purchase Details
Closed on
Mar 6, 2017
Sold by
Sanford Richard T and Sanford Family Trust
Bought by
R T Sanford Llc
Purchase Details
Closed on
Aug 16, 2012
Sold by
Sanford Richard T and Sanford Esther E
Bought by
Sanford Richard and Sanford Sarah
Purchase Details
Closed on
Nov 7, 2005
Sold by
Sanford Richard T and Sanford Esther E
Bought by
Sanford Richard T and Sanford Esther E
Create a Home Valuation Report for This Property
The Home Valuation Report is an in-depth analysis detailing your home's value as well as a comparison with similar homes in the area
Home Values in the Area
Average Home Value in this Area
Purchase History
| Date | Buyer | Sale Price | Title Company |
|---|---|---|---|
| Skabelund Steven R | -- | None Available | |
| R T Sanford Llc | -- | None Available | |
| Sanford Richard | -- | Pro Title And Escrow Inc | |
| Sanford Richard T | -- | -- |
Source: Public Records
Tax History Compared to Growth
Tax History
| Year | Tax Paid | Tax Assessment Tax Assessment Total Assessment is a certain percentage of the fair market value that is determined by local assessors to be the total taxable value of land and additions on the property. | Land | Improvement |
|---|---|---|---|---|
| 2025 | $2,118 | $235,840 | $111,500 | $317,300 |
| 2024 | $2,118 | $215,600 | $0 | $0 |
| 2023 | $2,094 | $213,675 | $0 | $0 |
| 2022 | $2,163 | $217,085 | $0 | $0 |
| 2021 | $1,788 | $287,800 | $82,000 | $205,800 |
| 2020 | $1,708 | $269,000 | $74,500 | $194,500 |
| 2019 | $1,472 | $237,700 | $64,300 | $173,400 |
| 2018 | $1,401 | $218,000 | $54,200 | $163,800 |
| 2017 | $1,278 | $106,975 | $0 | $0 |
| 2016 | $1,233 | $102,520 | $0 | $0 |
| 2015 | $1,125 | $92,895 | $0 | $0 |
| 2014 | $1,016 | $84,535 | $0 | $0 |
Source: Public Records
Map
Nearby Homes
- 534 S Main St
- 388 E 600 S
- 135 E 500 S
- 1836 S 100 E Unit 2
- 513 S 400 E
- 826 S 600 E
- 545 E 600 S
- 1161 Utah 198
- 803 S 640 E
- 370 E 300 S
- 969 S 640 E
- 533 S 700 W
- 1408 S 30 E
- 550 700 W
- 1398 S 400 St W
- 1163 S 730 W
- The Tracie Plan at Payson View Estates - Payson View
- The Madison Plan at Payson View Estates - Payson View
- The Avery Plan at Payson View Estates - Payson View
- The Roosevelt Plan at Payson View Estates - Payson View