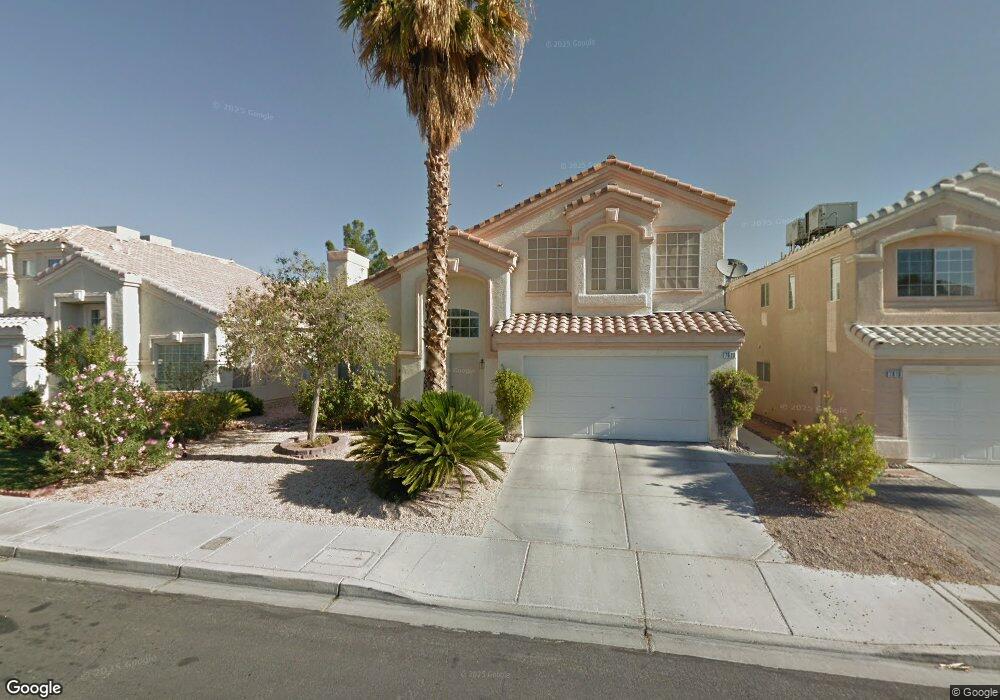
7820 Golden Talon Ave Unit n Las Vegas, NV 89131
Elkhorn Ranch NeighborhoodEstimated Value: $450,745 - $477,000
4
Beds
3
Baths
2,284
Sq Ft
$204/Sq Ft
Est. Value
About This Home
This home is located at 7820 Golden Talon Ave Unit n, Las Vegas, NV 89131 and is currently estimated at $465,186, approximately $203 per square foot. 7820 Golden Talon Ave Unit n is a home located in Clark County with nearby schools including Betsey A Rhodes Elementary School, Ralph Cadwallader Middle School, and Arbor View High School.
Ownership History
Date
Name
Owned For
Owner Type
Purchase Details
Closed on
Mar 4, 1998
Sold by
Elkhorn Partners Ltd Partnership
Bought by
Adamowicz Anthony J and Adamowicz Patricia
Current Estimated Value
Home Financials for this Owner
Home Financials are based on the most recent Mortgage that was taken out on this home.
Original Mortgage
$147,137
Outstanding Balance
$24,432
Interest Rate
7.02%
Mortgage Type
VA
Estimated Equity
$440,754
Purchase Details
Closed on
Feb 5, 1998
Sold by
Elkhorn Partners Ltd Partnership
Bought by
Tran Tuan and Tran Thanh Mai
Home Financials for this Owner
Home Financials are based on the most recent Mortgage that was taken out on this home.
Original Mortgage
$147,137
Outstanding Balance
$24,432
Interest Rate
7.02%
Mortgage Type
VA
Estimated Equity
$440,754
Create a Home Valuation Report for This Property
The Home Valuation Report is an in-depth analysis detailing your home's value as well as a comparison with similar homes in the area
Home Values in the Area
Average Home Value in this Area
Purchase History
| Date | Buyer | Sale Price | Title Company |
|---|---|---|---|
| Adamowicz Anthony J | $124,000 | United Title | |
| Tran Tuan | $144,500 | United Title |
Source: Public Records
Mortgage History
| Date | Status | Borrower | Loan Amount |
|---|---|---|---|
| Open | Tran Tuan | $147,137 |
Source: Public Records
Tax History Compared to Growth
Tax History
| Year | Tax Paid | Tax Assessment Tax Assessment Total Assessment is a certain percentage of the fair market value that is determined by local assessors to be the total taxable value of land and additions on the property. | Land | Improvement |
|---|---|---|---|---|
| 2025 | $2,462 | $101,570 | $32,550 | $69,020 |
| 2024 | $2,281 | $101,570 | $32,550 | $69,020 |
| 2023 | $2,281 | $101,039 | $35,700 | $65,339 |
| 2022 | $2,112 | $88,971 | $29,050 | $59,921 |
| 2021 | $1,956 | $83,332 | $26,250 | $57,082 |
| 2020 | $1,813 | $82,987 | $26,250 | $56,737 |
| 2019 | $1,699 | $77,655 | $21,700 | $55,955 |
| 2018 | $1,621 | $71,473 | $18,200 | $53,273 |
| 2017 | $2,283 | $69,656 | $15,750 | $53,906 |
| 2016 | $1,518 | $65,766 | $11,550 | $54,216 |
| 2015 | $1,515 | $49,417 | $8,750 | $40,667 |
| 2014 | $1,467 | $44,710 | $8,750 | $35,960 |
Source: Public Records
Map
Nearby Homes
- 7320 Misty Glow Ct
- 7908 Elk Stone Ave
- 7228 Buglehorn St
- 7252 Tigertail Ct
- 7812 Sparrowgate Ave
- 7817 Falconwing Ave
- 7813 Falconwing Ave
- 7208 Whisper Heights Ct
- 7816 Purple Mountain Ave
- 7305 Bosky Springs St
- 7413 Red Eagle St
- 7732 Silver Mallard Ave
- 8005 Exploration Ave
- 8037 Radigan Ave
- 7717 White Grass Ave
- 7925 High Stream Ave
- 7613 Falconwing Ave
- 7405 Painted Ridge St
- 7229 Robins Roost St
- 8056 Broken Spur Ln
- 7820 Golden Talon Ave
- 7816 Golden Talon Ave
- 7824 Golden Talon Ave
- 7821 Robinglen Ave
- 7825 Robinglen Ave
- 7812 Golden Talon Ave
- 7828 Golden Talon Ave Unit 2
- 7817 Robinglen Ave Unit none
- 7817 Robinglen Ave
- 7829 Robinglen Ave
- 7237 Golden Falcon St
- 7813 Robinglen Ave
- 7808 Golden Talon Ave
- 7240 Golden Falcon St
- 7233 Golden Falcon St Unit none
- 7233 Golden Falcon St Unit 3
- 7236 Golden Falcon St
- 7809 Robinglen Ave
- 7804 Golden Talon Ave