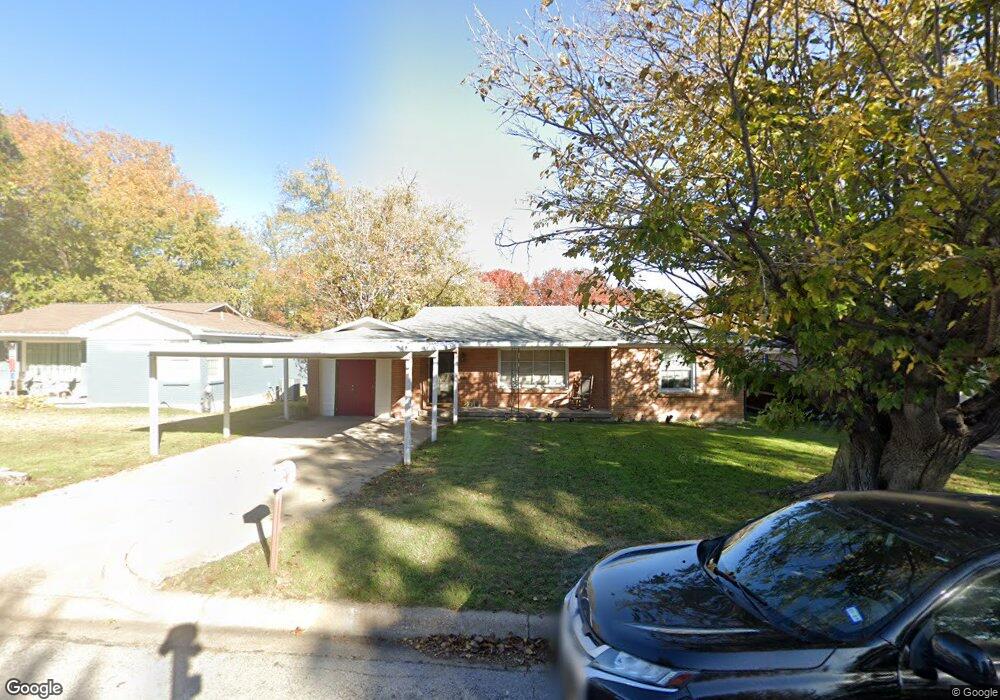
7820 Terry St Fort Worth, TX 76108
Estimated Value: $223,000 - $242,000
3
Beds
2
Baths
1,352
Sq Ft
$169/Sq Ft
Est. Value
About This Home
This home is located at 7820 Terry St, Fort Worth, TX 76108 and is currently estimated at $228,803, approximately $169 per square foot. 7820 Terry St is a home located in Tarrant County with nearby schools including Liberty Elementary School, Brewer Middle School, and Tannahill Intermediate School.
Ownership History
Date
Name
Owned For
Owner Type
Purchase Details
Closed on
Dec 10, 2021
Sold by
Herrington Ddovie
Bought by
Herrington Joel Benjamin
Current Estimated Value
Home Financials for this Owner
Home Financials are based on the most recent Mortgage that was taken out on this home.
Original Mortgage
$56,216
Outstanding Balance
$51,690
Interest Rate
3.09%
Mortgage Type
FHA
Estimated Equity
$177,113
Purchase Details
Closed on
Sep 22, 2010
Sold by
Adiron Corporation
Bought by
Herrington Dovie
Home Financials for this Owner
Home Financials are based on the most recent Mortgage that was taken out on this home.
Original Mortgage
$56,520
Interest Rate
4.42%
Mortgage Type
New Conventional
Purchase Details
Closed on
May 10, 2010
Sold by
Cummings Gregory and Cummings David
Bought by
Adiron Corporation
Purchase Details
Closed on
Feb 19, 2009
Sold by
Cummings Gary and Cummings Gregory
Bought by
Cummings Gregory and Cummings Gary Scott
Create a Home Valuation Report for This Property
The Home Valuation Report is an in-depth analysis detailing your home's value as well as a comparison with similar homes in the area
Home Values in the Area
Average Home Value in this Area
Purchase History
| Date | Buyer | Sale Price | Title Company |
|---|---|---|---|
| Herrington Joel Benjamin | -- | Texas Title Inc | |
| Herrington Dovie | -- | Fidelity National Title | |
| Adiron Corporation | -- | Fidelity Natl Title Agency | |
| Cummings Gregory | -- | None Available |
Source: Public Records
Mortgage History
| Date | Status | Borrower | Loan Amount |
|---|---|---|---|
| Open | Herrington Joel Benjamin | $56,216 | |
| Previous Owner | Herrington Dovie | $56,520 |
Source: Public Records
Tax History Compared to Growth
Tax History
| Year | Tax Paid | Tax Assessment Tax Assessment Total Assessment is a certain percentage of the fair market value that is determined by local assessors to be the total taxable value of land and additions on the property. | Land | Improvement |
|---|---|---|---|---|
| 2025 | $2,803 | $176,700 | $41,145 | $135,555 |
| 2024 | $2,803 | $186,000 | $41,145 | $144,855 |
| 2023 | $2,764 | $218,658 | $41,145 | $177,513 |
| 2022 | $4,442 | $164,026 | $25,000 | $139,026 |
| 2021 | $4,223 | $153,534 | $25,000 | $128,534 |
| 2020 | $3,721 | $134,298 | $25,000 | $109,298 |
| 2019 | $3,893 | $135,329 | $25,000 | $110,329 |
| 2018 | $2,996 | $104,139 | $12,000 | $92,139 |
| 2017 | $2,262 | $77,406 | $12,000 | $65,406 |
| 2016 | $2,211 | $75,665 | $12,000 | $63,665 |
| 2015 | $1,669 | $58,100 | $9,000 | $49,100 |
| 2014 | $1,669 | $58,100 | $9,000 | $49,100 |
Source: Public Records
Map
Nearby Homes
- 7836 Corina Dr
- 7805 Whitney Dr
- 730 S Cherry Ln
- 852 Odie Dr
- 867 Odie Dr
- 801 Ala Dr
- 149 Wilson Cliff Dr
- 501 Odie Dr
- 537 June Dr
- 633 Kimbrough St
- 872 June Dr
- 7704 Carlos St
- 8017 White Settlement Rd
- 2248 Tierra Madre Blvd
- 321 Meadow Park Dr
- 2220 Crested Saguaro St
- 2228 Crested Saguaro St
- 8016 Downe Dr
- 8232 Redonda St
- 8203 Delmar St