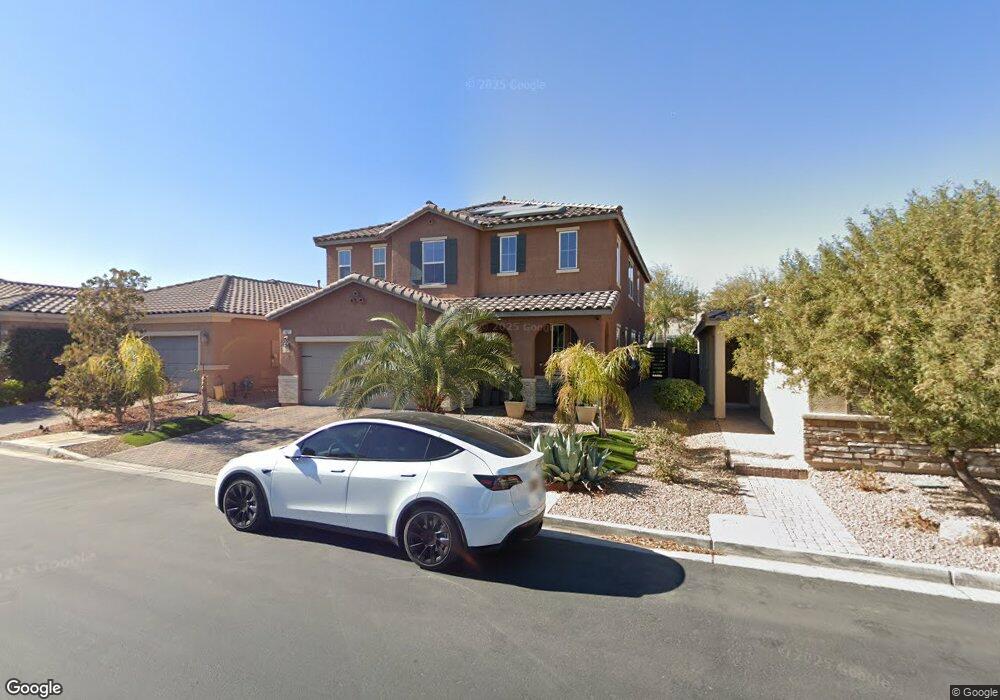
7821 Hamilton Pool Dr Las Vegas, NV 89113
Estimated Value: $616,000 - $751,000
5
Beds
4
Baths
3,057
Sq Ft
$224/Sq Ft
Est. Value
About This Home
This home is located at 7821 Hamilton Pool Dr, Las Vegas, NV 89113 and is currently estimated at $683,491, approximately $223 per square foot. 7821 Hamilton Pool Dr is a home with nearby schools including Judith D Steele Elementary School, Lawrence & Heidi Canarelli Middle School, and Sierra Vista High School.
Ownership History
Date
Name
Owned For
Owner Type
Purchase Details
Closed on
Dec 15, 2021
Sold by
Ninova Genoveva V
Bought by
Ninova Genoveva Vladimirova and Ninova Genoveva Vladimirova
Current Estimated Value
Purchase Details
Closed on
Nov 9, 2017
Sold by
Kyurkchiyska Diana A and Ninova Genoveva V
Bought by
Ninova Genoveva V
Home Financials for this Owner
Home Financials are based on the most recent Mortgage that was taken out on this home.
Original Mortgage
$282,103
Outstanding Balance
$236,264
Interest Rate
3.83%
Mortgage Type
New Conventional
Estimated Equity
$447,227
Purchase Details
Closed on
Sep 8, 2015
Sold by
Pentchev Sava and Pentchev Sava
Bought by
Kyurkchiyska Diana and Kyurkchiyska K
Home Financials for this Owner
Home Financials are based on the most recent Mortgage that was taken out on this home.
Original Mortgage
$287,750
Interest Rate
3.91%
Mortgage Type
New Conventional
Create a Home Valuation Report for This Property
The Home Valuation Report is an in-depth analysis detailing your home's value as well as a comparison with similar homes in the area
Home Values in the Area
Average Home Value in this Area
Purchase History
| Date | Buyer | Sale Price | Title Company |
|---|---|---|---|
| Ninova Genoveva Vladimirova | -- | Lawyers Title Henderson | |
| Ninova Genoveva V | -- | Fidelity National Title | |
| Ninova Genoveva A | -- | Fidelity National Title | |
| Kyurkchiyska Diana | -- | First American Title Insurance | |
| Kyurkchiyska Diana A | $359,745 | First American Title Insurance |
Source: Public Records
Mortgage History
| Date | Status | Borrower | Loan Amount |
|---|---|---|---|
| Open | Ninova Genoveva A | $282,103 | |
| Closed | Kyurkchiyska Diana A | $287,750 |
Source: Public Records
Tax History Compared to Growth
Tax History
| Year | Tax Paid | Tax Assessment Tax Assessment Total Assessment is a certain percentage of the fair market value that is determined by local assessors to be the total taxable value of land and additions on the property. | Land | Improvement |
|---|---|---|---|---|
| 2025 | $5,176 | $213,202 | $43,750 | $169,452 |
| 2024 | $5,026 | $213,202 | $43,750 | $169,452 |
| 2023 | $3,483 | $194,735 | $36,750 | $157,985 |
| 2022 | $4,879 | $178,847 | $35,000 | $143,847 |
| 2021 | $4,737 | $167,478 | $31,500 | $135,978 |
| 2020 | $4,596 | $164,573 | $30,450 | $134,123 |
| 2019 | $4,541 | $159,428 | $28,000 | $131,428 |
| 2018 | $3,722 | $128,195 | $23,800 | $104,395 |
| 2017 | $3,773 | $128,646 | $23,450 | $105,196 |
| 2016 | $3,483 | $17,500 | $17,500 | $0 |
| 2015 | $371 | $12,250 | $12,250 | $0 |
Source: Public Records
Map
Nearby Homes
- 7837 Hamilton Pool Dr
- 7701 W Robindale Rd Unit 127
- 7701 W Robindale Rd Unit 160
- 7701 W Robindale Rd Unit 274
- 7701 W Robindale Rd Unit 259
- 7861 Hamilton Pool Dr
- 7708 Park Village Place
- 7703 W Mesa Verde Ln
- 7609 Slide Rock Ave
- 7619 Comanche Canyon Ave
- 7681 W Mesa Verde Ln
- 7756 Seville Estates Ct
- 7977 Texas Hills St
- 7983 Texas Hills St
- 7584 Slide Rock Ave
- 8003 Adelaide Hills St
- 8057 Adelaide Hills St
- 7607 Pioneer Ranch Ave
- 7975 Mesquite Ranch St
- 7532 Coyote Cave Ave
- 7825 Hamilton Pool Dr
- 7817 Hamilton Pool Dr
- 7829 Hamilton Pool Dr
- 7813 Hamilton Pool Dr
- 7833 Hamilton Pool Dr
- 7809 Hamilton Pool Dr
- 7820 Hamilton Pool Dr
- 7816 Hamilton Pool Dr
- 7812 Hamilton Pool Dr
- 7824 Hamilton Pool Dr
- 7808 Hamilton Pool Dr
- 7805 Hamilton Pool Dr
- 7828 Hamilton Pool Dr
- 7832 Hamilton Pool Dr
- 7804 Hamilton Pool Dr
- 7841 Hamilton Pool Dr
- 7836 Hamilton Pool Dr
- 7845 Hamilton Pool Dr
- 0 S Buffalo Dr
- 7840 Hamilton Pool Dr