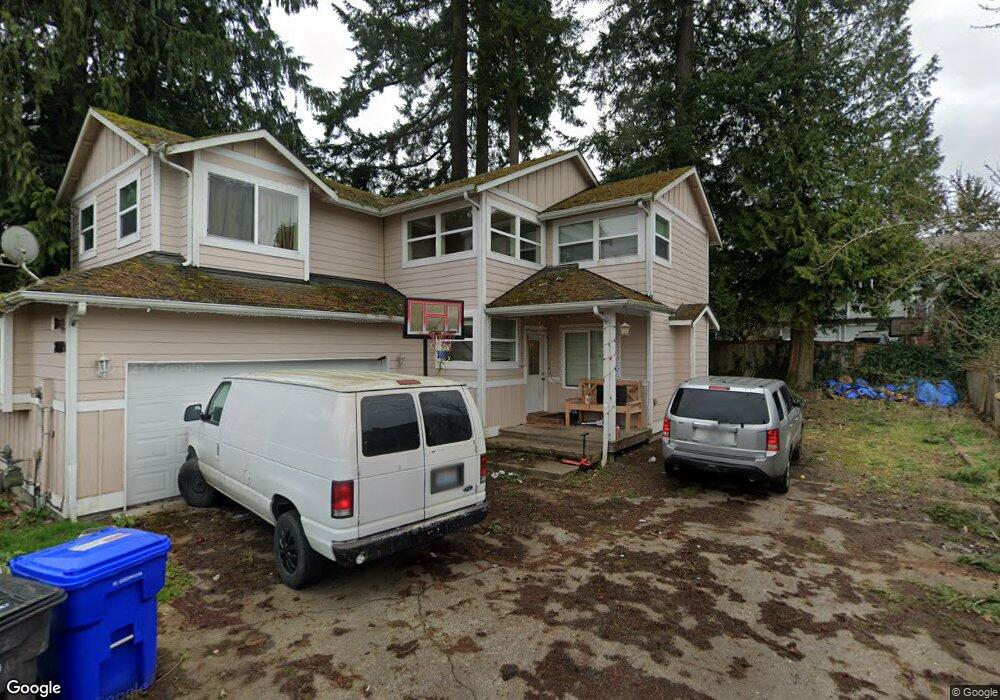
7822 Beverly Ln Unit A Everett, WA 98203
Evergreen NeighborhoodEstimated Value: $494,000 - $574,000
2
Beds
1
Bath
896
Sq Ft
$589/Sq Ft
Est. Value
About This Home
This home is located at 7822 Beverly Ln Unit A, Everett, WA 98203 and is currently estimated at $528,177, approximately $589 per square foot. 7822 Beverly Ln Unit A is a home located in Snohomish County with nearby schools including Lowell Elementary School, Evergreen Middle School, and Cascade High School.
Ownership History
Date
Name
Owned For
Owner Type
Purchase Details
Closed on
Oct 26, 2016
Sold by
Mccabe Thomas Adam and Day Jessica Lynn
Bought by
Healy Tyler J
Current Estimated Value
Home Financials for this Owner
Home Financials are based on the most recent Mortgage that was taken out on this home.
Original Mortgage
$237,650
Outstanding Balance
$191,272
Interest Rate
3.5%
Mortgage Type
New Conventional
Estimated Equity
$336,905
Purchase Details
Closed on
Jun 5, 2007
Sold by
Capes Greg and Capes Shelley
Bought by
Mccabe Thomas Adam and Day Jessica Lynn
Home Financials for this Owner
Home Financials are based on the most recent Mortgage that was taken out on this home.
Original Mortgage
$239,950
Interest Rate
6.14%
Mortgage Type
VA
Create a Home Valuation Report for This Property
The Home Valuation Report is an in-depth analysis detailing your home's value as well as a comparison with similar homes in the area
Home Values in the Area
Average Home Value in this Area
Purchase History
| Date | Buyer | Sale Price | Title Company |
|---|---|---|---|
| Healy Tyler J | $245,000 | Chicago Title Company Of Wa | |
| Mccabe Thomas Adam | $239,950 | Pnwt |
Source: Public Records
Mortgage History
| Date | Status | Borrower | Loan Amount |
|---|---|---|---|
| Open | Healy Tyler J | $237,650 | |
| Previous Owner | Mccabe Thomas Adam | $239,950 |
Source: Public Records
Tax History
| Year | Tax Paid | Tax Assessment Tax Assessment Total Assessment is a certain percentage of the fair market value that is determined by local assessors to be the total taxable value of land and additions on the property. | Land | Improvement |
|---|---|---|---|---|
| 2025 | $3,590 | $430,600 | $316,800 | $113,800 |
| 2024 | $3,590 | $416,900 | $303,100 | $113,800 |
| 2023 | $3,815 | $463,400 | $326,800 | $136,600 |
| 2022 | $3,111 | $338,900 | $219,600 | $119,300 |
| 2020 | $3,135 | $278,600 | $171,900 | $106,700 |
| 2019 | $2,926 | $261,700 | $156,600 | $105,100 |
| 2018 | $2,877 | $235,900 | $140,400 | $95,500 |
| 2017 | $2,530 | $206,700 | $120,600 | $86,100 |
| 2016 | $2,249 | $193,100 | $99,000 | $94,100 |
Source: Public Records
Map
Nearby Homes
- 7525 Beverly Ln
- 7910 E Glen Dr
- 323 75th St SE Unit A14
- 323 75th St SE Unit B10
- 9 76th St SE
- 615 75th St SE Unit C52
- 747 75th St SE Unit B203
- 820 Cady Rd Unit H304
- 820 Cady Rd Unit B305
- 820 Cady Rd Unit F103
- 6916 Beverly Ln
- 126 W Casino Rd Unit 5
- 501 75th Place SW
- 27 M Cascade Dr
- 7515 Cascade Dr
- 7027 Rainier Dr Unit E
- 7027 Rainier Dr Unit G
- 7027 Rainier Dr Unit H
- 7027 Rainier Dr Unit A
- 8911 Holly Dr Unit 104
- 7822 Beverly Ln
- 7822 Beverly Ln Unit C
- 7822 Beverly Ln Unit B
- 7820 Beverly Ln
- 7826 Beverly Ln
- 127 Barbara Ln
- 7818 Beverly Ln
- 7810 Beverly Ln
- 129 Barbara Ln
- 7812 Beverly Ln
- 7816 Beverly Ln
- 7830 Beverly Ln
- 7727 Easy St
- 221 Barbara Ln
- 124 Barbara Ln
- 7814 Beverly Ln
- 7724 Easy St
- 7721 Easy St
- 211 Barbara Ln
- 216 Barbara Ln
Your Personal Tour Guide
Ask me questions while you tour the home.