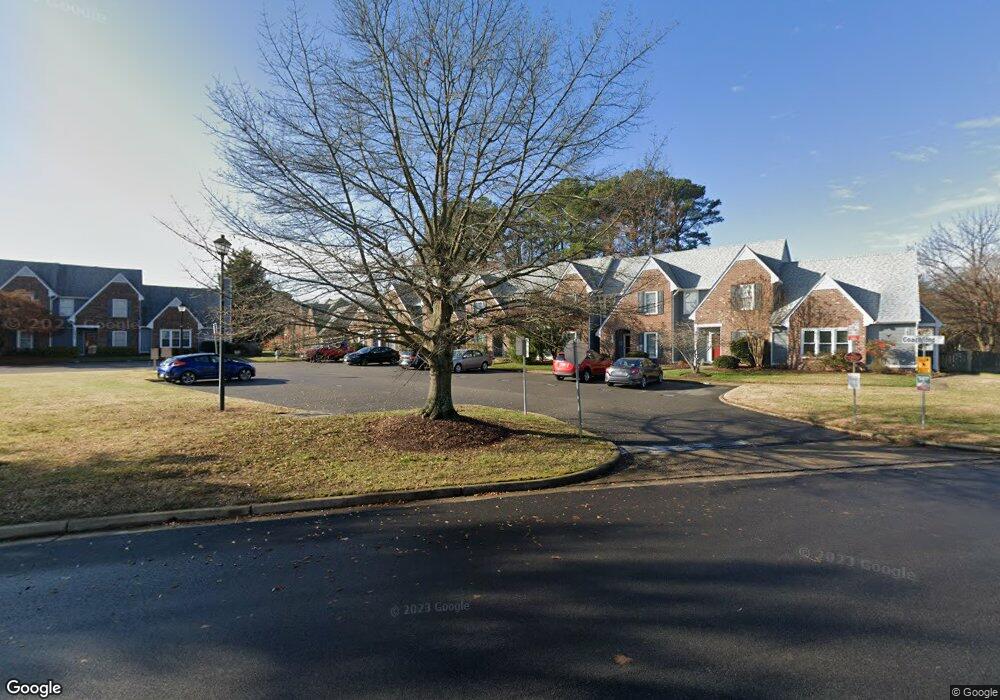
7822 Coachford Ct Unit n/a Henrico, VA 23228
Laurel NeighborhoodEstimated Value: $271,172 - $284,000
2
Beds
3
Baths
1,228
Sq Ft
$225/Sq Ft
Est. Value
About This Home
This home is located at 7822 Coachford Ct Unit n/a, Henrico, VA 23228 and is currently estimated at $276,543, approximately $225 per square foot. 7822 Coachford Ct Unit n/a is a home located in Henrico County with nearby schools including Dumbarton Elementary School, Brookland Middle School, and Hermitage High School.
Ownership History
Date
Name
Owned For
Owner Type
Purchase Details
Closed on
Mar 9, 2015
Sold by
Wroldson Holly A
Bought by
Resnick Steven J
Current Estimated Value
Home Financials for this Owner
Home Financials are based on the most recent Mortgage that was taken out on this home.
Original Mortgage
$104,000
Outstanding Balance
$79,624
Interest Rate
3.67%
Mortgage Type
VA
Estimated Equity
$196,919
Purchase Details
Closed on
Oct 13, 2009
Sold by
Henderson Kathy Denise
Bought by
Wroldson Holly A
Home Financials for this Owner
Home Financials are based on the most recent Mortgage that was taken out on this home.
Original Mortgage
$152,142
Interest Rate
5.09%
Mortgage Type
FHA
Purchase Details
Closed on
Oct 16, 1996
Sold by
Eads N Eads H and Eads M
Bought by
Carter Kathy D
Home Financials for this Owner
Home Financials are based on the most recent Mortgage that was taken out on this home.
Original Mortgage
$83,227
Interest Rate
8.26%
Mortgage Type
VA
Create a Home Valuation Report for This Property
The Home Valuation Report is an in-depth analysis detailing your home's value as well as a comparison with similar homes in the area
Home Values in the Area
Average Home Value in this Area
Purchase History
| Date | Buyer | Sale Price | Title Company |
|---|---|---|---|
| Resnick Steven J | $130,000 | -- | |
| Wroldson Holly A | $154,950 | -- | |
| Carter Kathy D | $81,000 | -- |
Source: Public Records
Mortgage History
| Date | Status | Borrower | Loan Amount |
|---|---|---|---|
| Open | Resnick Steven J | $104,000 | |
| Previous Owner | Wroldson Holly A | $152,142 | |
| Previous Owner | Carter Kathy D | $83,227 |
Source: Public Records
Tax History Compared to Growth
Tax History
| Year | Tax Paid | Tax Assessment Tax Assessment Total Assessment is a certain percentage of the fair market value that is determined by local assessors to be the total taxable value of land and additions on the property. | Land | Improvement |
|---|---|---|---|---|
| 2025 | $2,206 | $234,500 | $44,000 | $190,500 |
| 2024 | $2,206 | $216,500 | $40,000 | $176,500 |
| 2023 | $1,840 | $216,500 | $40,000 | $176,500 |
| 2022 | $1,590 | $187,100 | $36,000 | $151,100 |
| 2021 | $1,522 | $164,400 | $32,000 | $132,400 |
| 2020 | $1,430 | $164,400 | $32,000 | $132,400 |
| 2019 | $1,308 | $150,300 | $32,000 | $118,300 |
| 2018 | $1,216 | $139,800 | $32,000 | $107,800 |
| 2017 | $1,165 | $133,900 | $32,000 | $101,900 |
| 2016 | $1,074 | $123,400 | $32,000 | $91,400 |
| 2015 | $994 | $117,500 | $32,000 | $85,500 |
| 2014 | $994 | $114,300 | $32,000 | $82,300 |
Source: Public Records
Map
Nearby Homes
- 4948 Tanfield Dr
- 7810 Camolin Ct
- 7816 Camolin Ct
- 4914 Banbridge Ct
- 7707 Odonnell Ct Unit 2101
- 7707 Odonnell Ct Unit 2102
- 8174 Carriage Homes Dr
- 8420 Obannon Ct Unit 1102
- 7701 Okeith Ct Unit 1601
- 7604 Roscommon Ct Unit 2403
- 7604 Portadown Ct Unit 2712
- 8402 Muldoon Ct Unit 202
- 8122 Carriage Bend Ln
- 5641 Knockadoon Ct
- 8140 Tonga Cart Ln
- 5625 Knockadoon Ct
- 4816 Breeching Dee Ln
- 9560 Hungary Woods Dr
- 8106 Side Spring Terrace
- 8105 Side Spring Terrace
- 7822 Coachford Ct
- 7822 Coachford Ct Unit 7822
- 7820 Coachford Ct
- 7824 Coachford Ct
- 7824 Coachford Ct
- 7824 Coachford Ct Unit 7824
- 7826 Coachford Ct
- 7818 Coachford Ct
- 7818 Coachford Ct
- 7828 Coachford Ct
- 7830 Coachford Ct
- 7817 Camolin Ct
- 7817 Camolin Ct Unit End unit
- 7832 Coachford Ct
- 7832 Coachford Ct
- 7832 Coachford Ct Unit 7832
- 7816 Coachford Ct
- 7816 Coachford Ct Unit 7816
- 7819 Camolin Ct
- 4931 Green Run Dr