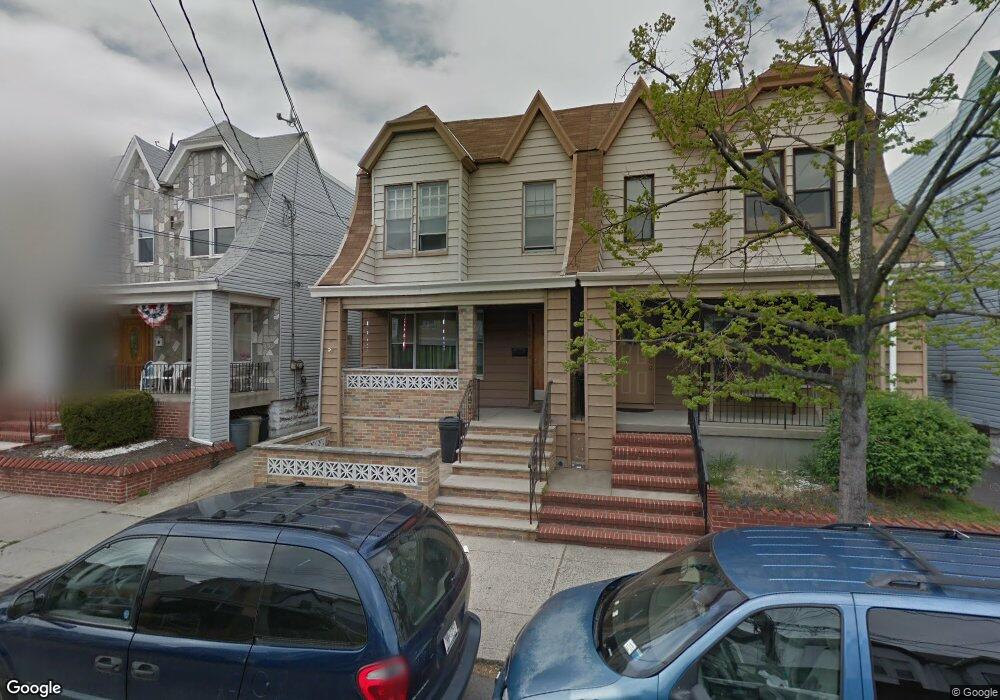
7823 68th Ave Middle Village, NY 11379
Middle Village NeighborhoodEstimated Value: $949,064 - $985,000
--
Bed
--
Bath
1,800
Sq Ft
$539/Sq Ft
Est. Value
About This Home
This home is located at 7823 68th Ave, Middle Village, NY 11379 and is currently estimated at $970,516, approximately $539 per square foot. 7823 68th Ave is a home located in Queens County with nearby schools including P.S. 87 - Middle Village, Queens Metropolitan High School, and St. Margaret Catholic Academy.
Ownership History
Date
Name
Owned For
Owner Type
Purchase Details
Closed on
Jun 16, 2025
Sold by
Hinkelday Alice and Lombardozzi Alice
Bought by
Lombardozzi-Fountain Stephanie
Current Estimated Value
Purchase Details
Closed on
Jun 9, 1997
Sold by
Otremba Mary
Bought by
Hinkelday Lorence and Lombardozzi Steven
Home Financials for this Owner
Home Financials are based on the most recent Mortgage that was taken out on this home.
Original Mortgage
$228,000
Interest Rate
7.7%
Create a Home Valuation Report for This Property
The Home Valuation Report is an in-depth analysis detailing your home's value as well as a comparison with similar homes in the area
Home Values in the Area
Average Home Value in this Area
Purchase History
| Date | Buyer | Sale Price | Title Company |
|---|---|---|---|
| Lombardozzi-Fountain Stephanie | -- | -- | |
| Hinkelday Alice | -- | -- | |
| Hinkelday Lorence | $240,000 | Fidelity National Title Ins | |
| Hinkelday Lorence | $240,000 | Fidelity National Title Ins |
Source: Public Records
Mortgage History
| Date | Status | Borrower | Loan Amount |
|---|---|---|---|
| Previous Owner | Hinkelday Lorence | $228,000 |
Source: Public Records
Tax History Compared to Growth
Tax History
| Year | Tax Paid | Tax Assessment Tax Assessment Total Assessment is a certain percentage of the fair market value that is determined by local assessors to be the total taxable value of land and additions on the property. | Land | Improvement |
|---|---|---|---|---|
| 2025 | $6,131 | $31,458 | $8,524 | $22,934 |
| 2024 | $6,131 | $30,524 | $9,362 | $21,162 |
| 2023 | $5,785 | $28,805 | $8,444 | $20,361 |
| 2022 | $5,493 | $45,600 | $15,900 | $29,700 |
| 2021 | $5,519 | $48,780 | $15,900 | $32,880 |
| 2020 | $5,549 | $48,540 | $15,900 | $32,640 |
| 2019 | $5,321 | $49,140 | $15,900 | $33,240 |
| 2018 | $4,893 | $24,004 | $8,124 | $15,880 |
| 2017 | $4,674 | $22,929 | $9,464 | $13,465 |
| 2016 | $4,369 | $22,929 | $9,464 | $13,465 |
| 2015 | $2,389 | $21,846 | $11,633 | $10,213 |
| 2014 | $2,389 | $21,198 | $13,535 | $7,663 |
Source: Public Records
Map
Nearby Homes