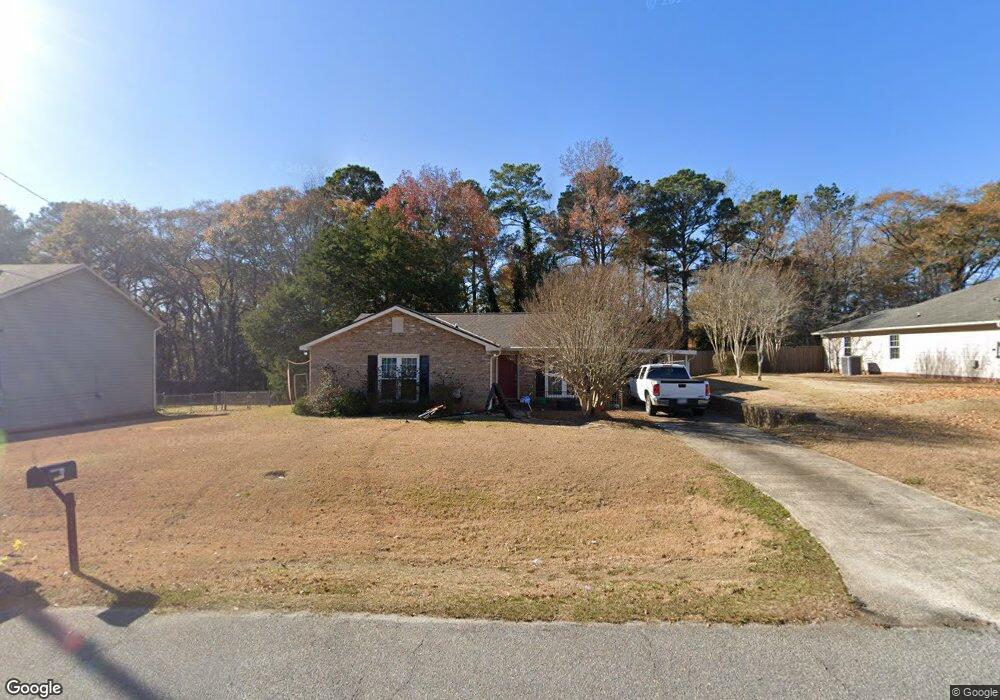
7823 Crescent Dr Columbus, GA 31909
Northern Columbus NeighborhoodEstimated Value: $224,000 - $233,000
3
Beds
2
Baths
1,397
Sq Ft
$164/Sq Ft
Est. Value
About This Home
This home is located at 7823 Crescent Dr, Columbus, GA 31909 and is currently estimated at $228,511, approximately $163 per square foot. 7823 Crescent Dr is a home located in Muscogee County with nearby schools including North Columbus Elementary School, Veterans Memorial Middle School, and Northside High School.
Ownership History
Date
Name
Owned For
Owner Type
Purchase Details
Closed on
Sep 30, 2020
Sold by
Yepez Heather
Bought by
Shehane Julie Longstreet
Current Estimated Value
Home Financials for this Owner
Home Financials are based on the most recent Mortgage that was taken out on this home.
Original Mortgage
$145,319
Outstanding Balance
$129,254
Interest Rate
2.9%
Mortgage Type
New Conventional
Estimated Equity
$99,258
Purchase Details
Closed on
Mar 10, 2010
Sold by
Westfall Brittni A and Newsome David Brent
Bought by
Downey Heather L
Home Financials for this Owner
Home Financials are based on the most recent Mortgage that was taken out on this home.
Original Mortgage
$132,554
Interest Rate
4.75%
Mortgage Type
FHA
Purchase Details
Closed on
Aug 20, 2008
Sold by
Newsome David Brent
Bought by
Westfall Brittni A and Newsome David Brent
Create a Home Valuation Report for This Property
The Home Valuation Report is an in-depth analysis detailing your home's value as well as a comparison with similar homes in the area
Home Values in the Area
Average Home Value in this Area
Purchase History
| Date | Buyer | Sale Price | Title Company |
|---|---|---|---|
| Shehane Julie Longstreet | $148,000 | -- | |
| Downey Heather L | $135,000 | None Available | |
| Westfall Brittni A | -- | None Available |
Source: Public Records
Mortgage History
| Date | Status | Borrower | Loan Amount |
|---|---|---|---|
| Open | Shehane Julie Longstreet | $145,319 | |
| Previous Owner | Downey Heather L | $132,554 |
Source: Public Records
Tax History Compared to Growth
Tax History
| Year | Tax Paid | Tax Assessment Tax Assessment Total Assessment is a certain percentage of the fair market value that is determined by local assessors to be the total taxable value of land and additions on the property. | Land | Improvement |
|---|---|---|---|---|
| 2025 | $1,799 | $71,012 | $11,536 | $59,476 |
| 2024 | $1,798 | $71,012 | $11,536 | $59,476 |
| 2023 | $1,115 | $71,012 | $11,536 | $59,476 |
| 2022 | $1,875 | $59,144 | $11,536 | $47,608 |
| 2021 | $1,868 | $59,144 | $11,536 | $47,608 |
| 2020 | $1,659 | $49,872 | $11,536 | $38,336 |
| 2019 | $1,666 | $50,012 | $11,536 | $38,476 |
| 2018 | $1,666 | $50,012 | $11,536 | $38,476 |
| 2017 | $1,673 | $50,012 | $11,536 | $38,476 |
| 2016 | $1,680 | $55,200 | $5,247 | $49,953 |
| 2015 | $1,683 | $55,200 | $5,247 | $49,953 |
| 2014 | $1,685 | $55,200 | $5,247 | $49,953 |
| 2013 | -- | $55,200 | $5,247 | $49,953 |
Source: Public Records
Map
Nearby Homes
- 7559 Crescent Dr
- 7407 Peppercorn Dr
- 1727 Fountain Ct
- 1719 Double Churches Rd
- 7995 Big Creek Place
- 7313 Sesame St
- 1535 Doubletree Dr
- 8300 Fortson Rd
- 1438 Grove Park Dr Unit 13B
- 8350 Fortson Rd
- 1579 Magnolia Way
- 8217 Remey Dr
- 8008 Lagoon Ct
- 18 Peppertree Ct
- 7700 Veterans Pkwy
- 7170 Bridgemill Dr
- 7185 Helen Dr
- 9 Libby Ct
- 1512 Tom Buk Tu Ln
- 8082 Veterans Pkwy
- 7815 Crescent Dr
- 7829 Crescent Dr
- 7811 Crescent Dr
- 7833 Crescent Dr
- 4105 Lakeview Dr
- 7805 Crescent Dr
- 7818 Crescent Dr
- 7824 Crescent Dr
- 7830 Crescent Dr
- 7812 Crescent Dr
- 7758 Lloyd Rd
- 7814 Lloyd Rd
- 7907 Crescent Dr
- 7836 Crescent Dr
- 7747 Crescent Dr
- 7857 Crescent Dr
- 7758 Crescent Dr
- 7900 Crescent Dr
- 7838 Lloyd Rd
- 7784 Lloyd Rd