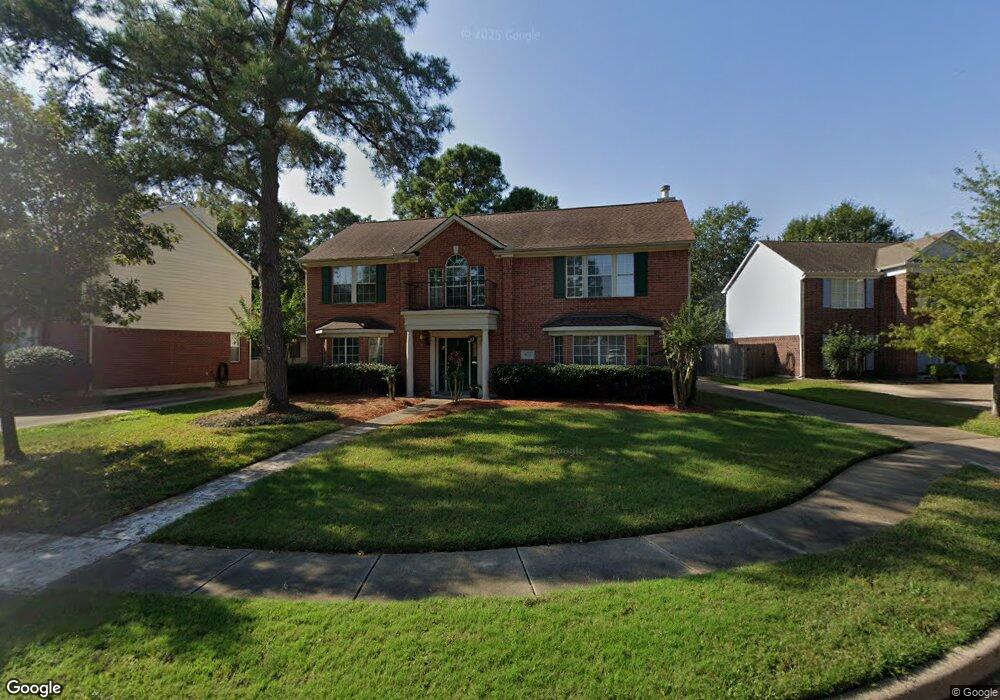
7823 Palm Brook Ct Houston, TX 77095
Copperfield NeighborhoodEstimated Value: $344,800 - $362,000
4
Beds
3
Baths
2,546
Sq Ft
$139/Sq Ft
Est. Value
About This Home
This home is located at 7823 Palm Brook Ct, Houston, TX 77095 and is currently estimated at $354,700, approximately $139 per square foot. 7823 Palm Brook Ct is a home located in Harris County with nearby schools including Copeland Elementary School, Aragon Middle School, and Langham Creek High School.
Ownership History
Date
Name
Owned For
Owner Type
Purchase Details
Closed on
Mar 22, 2024
Sold by
Frank Edmund L
Bought by
Frank Jane Carol
Current Estimated Value
Purchase Details
Closed on
Nov 13, 2002
Sold by
Johnson Jonathan A and Johnson Rachel L
Bought by
Frank Edmund L and Frank Jane C
Home Financials for this Owner
Home Financials are based on the most recent Mortgage that was taken out on this home.
Original Mortgage
$134,400
Interest Rate
6%
Purchase Details
Closed on
Jul 13, 2001
Sold by
Crichton Brook P and Crichton Loretta
Bought by
Johnson Jonathan A and Johnson Rachel L
Home Financials for this Owner
Home Financials are based on the most recent Mortgage that was taken out on this home.
Original Mortgage
$128,000
Interest Rate
7.18%
Mortgage Type
Balloon
Create a Home Valuation Report for This Property
The Home Valuation Report is an in-depth analysis detailing your home's value as well as a comparison with similar homes in the area
Home Values in the Area
Average Home Value in this Area
Purchase History
| Date | Buyer | Sale Price | Title Company |
|---|---|---|---|
| Frank Jane Carol | -- | None Listed On Document | |
| Frank Edmund L | -- | Startex Title Company | |
| Johnson Jonathan A | -- | Startex Title Company |
Source: Public Records
Mortgage History
| Date | Status | Borrower | Loan Amount |
|---|---|---|---|
| Previous Owner | Frank Edmund L | $134,400 | |
| Previous Owner | Johnson Jonathan A | $128,000 | |
| Closed | Frank Edmund L | $16,800 |
Source: Public Records
Tax History Compared to Growth
Tax History
| Year | Tax Paid | Tax Assessment Tax Assessment Total Assessment is a certain percentage of the fair market value that is determined by local assessors to be the total taxable value of land and additions on the property. | Land | Improvement |
|---|---|---|---|---|
| 2025 | $4,966 | $329,283 | $77,846 | $251,437 |
| 2024 | $4,966 | $325,357 | $64,872 | $260,485 |
| 2023 | $4,966 | $339,465 | $64,872 | $274,593 |
| 2022 | $6,536 | $303,534 | $54,187 | $249,347 |
| 2021 | $6,235 | $252,735 | $54,187 | $198,548 |
| 2020 | $5,871 | $229,388 | $41,594 | $187,794 |
| 2019 | $5,753 | $219,508 | $41,594 | $177,914 |
| 2018 | $2,169 | $219,508 | $41,594 | $177,914 |
| 2017 | $5,677 | $219,508 | $41,594 | $177,914 |
| 2016 | $5,263 | $219,508 | $41,594 | $177,914 |
| 2015 | $3,308 | $189,891 | $32,054 | $157,837 |
| 2014 | $3,308 | $170,000 | $26,712 | $143,288 |
Source: Public Records
Map
Nearby Homes
- 7626 Almond Springs Dr
- 7807 Hickory Mill Ct
- 17214 Palm Falls Ct
- 7810 Timberline Run Ln
- 17010 Poplar Hill St
- 7539 Wildwood Brook Ct
- 17310 Crescent Canyon Dr
- 17710 Noble Oak Ct
- 17518 Rustling Aspen Ln
- 17326 Masonridge Dr
- 17222 Crown Meadow Ct
- 16911 Shady Square Ct
- 17522 Masonridge Dr
- 17114 Sheffield Pines Ln
- 17814 Stoney Glade Ct
- 8410 Castle Pond Ct
- 16902 Terrace Park Dr
- 7614 Mccormick Mill Ct
- 17206 Haley Falls Ln
- 7622 Mccormick Mill Ct
- 7819 Palm Brook Ct
- 7827 Palm Brook Ct
- 17222 Mesa Springs Ct
- 17226 Mesa Springs Ct
- 7815 Palm Brook Ct
- 17218 Mesa Springs Ct
- 7826 Palm Brook Ct
- 7822 Palm Brook Ct
- 7830 Palm Brook Ct
- 7814 Palm Brook Ct
- 17311 Emerald Isle Dr
- 17203 Mesa Springs Ct
- 17207 Mesa Springs Ct
- 17111 Holly Falls Ct
- 17115 Holly Falls Ct
- 17223 Mesa Springs Ct
- 7823 Granite Ridge Ln
- 17227 Mesa Springs Ct
- 7806 Palm Brook Ct
- 17211 Mesa Springs Ct