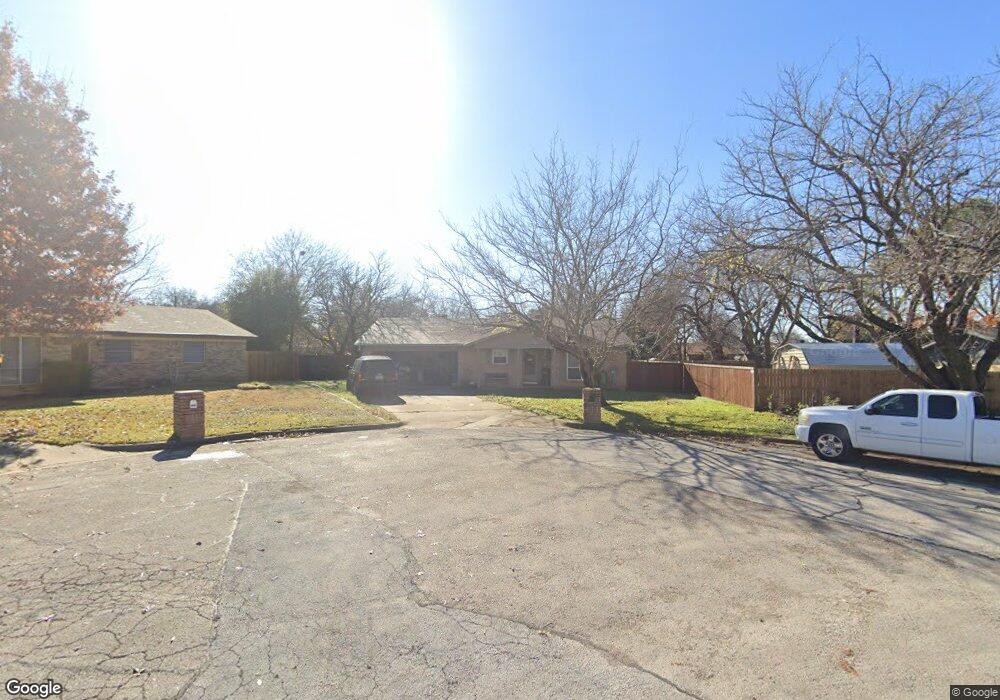
7824 Gibbons Ct North Richland Hills, TX 76180
Estimated Value: $238,000 - $262,000
3
Beds
2
Baths
1,186
Sq Ft
$212/Sq Ft
Est. Value
About This Home
This home is located at 7824 Gibbons Ct, North Richland Hills, TX 76180 and is currently estimated at $251,434, approximately $212 per square foot. 7824 Gibbons Ct is a home located in Tarrant County with nearby schools including Academy at C.F. Thomas Elementary, Richland Middle School, and Birdville High School.
Ownership History
Date
Name
Owned For
Owner Type
Purchase Details
Closed on
Nov 30, 2001
Sold by
Holmes Jerry Wayne and Homes Sophia
Bought by
Deuerling Sharon K
Current Estimated Value
Home Financials for this Owner
Home Financials are based on the most recent Mortgage that was taken out on this home.
Original Mortgage
$81,852
Outstanding Balance
$31,984
Interest Rate
6.57%
Estimated Equity
$219,450
Purchase Details
Closed on
Feb 25, 1998
Sold by
Barnett Andra Vanessa
Bought by
Holmes Jerry Wayne and Holmes Sophia
Home Financials for this Owner
Home Financials are based on the most recent Mortgage that was taken out on this home.
Original Mortgage
$70,961
Interest Rate
7.01%
Mortgage Type
FHA
Purchase Details
Closed on
Oct 14, 1994
Sold by
Horton Stephen H
Bought by
Barnett Andra Vanessa
Home Financials for this Owner
Home Financials are based on the most recent Mortgage that was taken out on this home.
Original Mortgage
$54,625
Interest Rate
8.5%
Mortgage Type
Seller Take Back
Create a Home Valuation Report for This Property
The Home Valuation Report is an in-depth analysis detailing your home's value as well as a comparison with similar homes in the area
Home Values in the Area
Average Home Value in this Area
Purchase History
| Date | Buyer | Sale Price | Title Company |
|---|---|---|---|
| Deuerling Sharon K | -- | Commonwealth Land Title | |
| Holmes Jerry Wayne | -- | Stewart Title North Texas In | |
| Barnett Andra Vanessa | -- | -- |
Source: Public Records
Mortgage History
| Date | Status | Borrower | Loan Amount |
|---|---|---|---|
| Open | Deuerling Sharon K | $81,852 | |
| Previous Owner | Holmes Jerry Wayne | $70,961 | |
| Previous Owner | Barnett Andra Vanessa | $54,625 |
Source: Public Records
Tax History Compared to Growth
Tax History
| Year | Tax Paid | Tax Assessment Tax Assessment Total Assessment is a certain percentage of the fair market value that is determined by local assessors to be the total taxable value of land and additions on the property. | Land | Improvement |
|---|---|---|---|---|
| 2025 | $1,708 | $167,123 | $45,000 | $122,123 |
| 2024 | $1,708 | $167,123 | $45,000 | $122,123 |
| 2023 | $2,906 | $145,228 | $45,000 | $100,228 |
| 2022 | $2,898 | $122,818 | $23,000 | $99,818 |
| 2021 | $2,786 | $131,984 | $23,000 | $108,984 |
| 2020 | $2,533 | $138,575 | $23,000 | $115,575 |
| 2019 | $2,383 | $139,634 | $23,000 | $116,634 |
| 2018 | $1,730 | $82,256 | $23,000 | $59,256 |
| 2017 | $2,012 | $118,710 | $23,000 | $95,710 |
| 2016 | $1,829 | $72,551 | $15,000 | $57,551 |
| 2015 | $1,388 | $61,800 | $15,000 | $46,800 |
| 2014 | $1,388 | $61,800 | $15,000 | $46,800 |
Source: Public Records
Map
Nearby Homes
- 5113 Bob Dr
- 7717 Janetta Dr
- 8020 Laura St
- 5020 Colorado Blvd
- 5304 Colorado Blvd
- 5108 Nancy Ln
- 5336 Davis Blvd
- 5016 Wyoming Trail
- 7908 Lazy Lane Rd
- 4916 Susan Lee Ln
- 5024 Maryanna Way
- 5320 Topper Dr
- 5117 Maryanna Way
- 5016 Winder Ct
- 8417 Emerald Cir
- 7529 Susan Ct
- 7821 Davis Blvd
- 7521 Susan Ct
- 8304 Emerald Cir
- 7501 Lola Dr
- 7828 Gibbons Ct
- 5108 Gibbons Dr
- 5112 Gibbons Dr
- 7829 Standley St
- 7825 Standley St
- 7833 Standley St
- 7821 Standley St
- 5105 Grove St
- 5113 Grove St
- 7829 Gibbons Ct
- 5120 Gibbons Dr
- 5101 Grove St
- 5117 Grove St
- 7825 Gibbons Ct
- 5109 Gibbons Dr
- 5113 Gibbons Dr
- 5105 Gibbons Dr
- 7828 Standley St
- 7824 Standley St
- 5121 Grove St