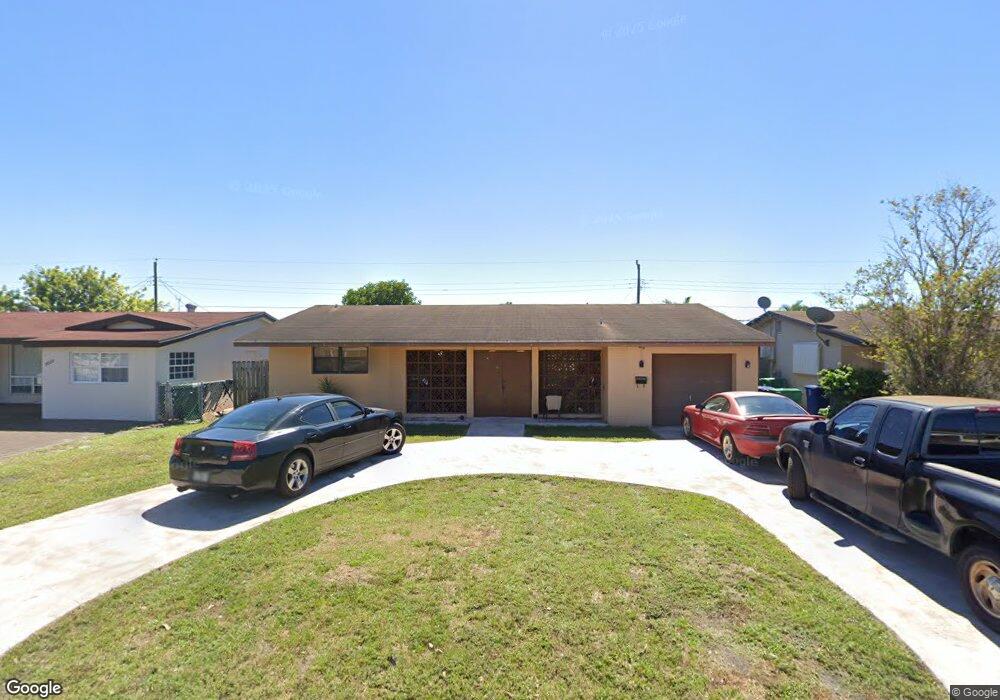
7824 Venetian St Miramar, FL 33023
Miramar Tropical NeighborhoodEstimated Value: $498,559 - $553,000
3
Beds
2
Baths
1,516
Sq Ft
$344/Sq Ft
Est. Value
About This Home
This home is located at 7824 Venetian St, Miramar, FL 33023 and is currently estimated at $521,640, approximately $344 per square foot. 7824 Venetian St is a home located in Broward County with nearby schools including Sunshine Elementary School, New Renaissance Middle School, and Miramar High School.
Ownership History
Date
Name
Owned For
Owner Type
Purchase Details
Closed on
May 12, 2005
Sold by
James Claude A and James Synethia A
Bought by
James Claude A
Current Estimated Value
Home Financials for this Owner
Home Financials are based on the most recent Mortgage that was taken out on this home.
Original Mortgage
$143,000
Outstanding Balance
$73,841
Interest Rate
5.69%
Mortgage Type
New Conventional
Estimated Equity
$447,799
Purchase Details
Closed on
Jun 5, 1998
Sold by
James Synethia
Bought by
James Synethia and James Claude
Home Financials for this Owner
Home Financials are based on the most recent Mortgage that was taken out on this home.
Original Mortgage
$84,611
Interest Rate
7.15%
Mortgage Type
FHA
Purchase Details
Closed on
Sep 8, 1995
Sold by
Somwaru Ibrahim and Somwaru Zameela
Bought by
James Claude and James Synethia
Home Financials for this Owner
Home Financials are based on the most recent Mortgage that was taken out on this home.
Original Mortgage
$80,624
Interest Rate
7.76%
Mortgage Type
FHA
Purchase Details
Closed on
Nov 1, 1989
Sold by
Available Not
Bought by
Available Not
Create a Home Valuation Report for This Property
The Home Valuation Report is an in-depth analysis detailing your home's value as well as a comparison with similar homes in the area
Home Values in the Area
Average Home Value in this Area
Purchase History
| Date | Buyer | Sale Price | Title Company |
|---|---|---|---|
| James Claude A | -- | Floridian Home Title Corp | |
| James Synethia | $100 | -- | |
| James Claude | $79,800 | -- | |
| Available Not | $58,929 | -- |
Source: Public Records
Mortgage History
| Date | Status | Borrower | Loan Amount |
|---|---|---|---|
| Open | James Claude A | $143,000 | |
| Closed | James Claude | $84,611 | |
| Previous Owner | James Claude | $80,624 |
Source: Public Records
Tax History Compared to Growth
Tax History
| Year | Tax Paid | Tax Assessment Tax Assessment Total Assessment is a certain percentage of the fair market value that is determined by local assessors to be the total taxable value of land and additions on the property. | Land | Improvement |
|---|---|---|---|---|
| 2025 | $2,588 | $145,250 | -- | -- |
| 2024 | $2,523 | $141,160 | -- | -- |
| 2023 | $2,523 | $137,050 | $0 | $0 |
| 2022 | $2,311 | $133,060 | $0 | $0 |
| 2021 | $2,255 | $129,190 | $0 | $0 |
| 2020 | $2,226 | $127,410 | $0 | $0 |
| 2019 | $2,193 | $124,550 | $0 | $0 |
| 2018 | $2,097 | $122,230 | $0 | $0 |
| 2017 | $2,011 | $119,720 | $0 | $0 |
| 2016 | $1,998 | $117,260 | $0 | $0 |
| 2015 | $1,977 | $116,450 | $0 | $0 |
| 2014 | $1,928 | $115,530 | $0 | $0 |
| 2013 | -- | $113,830 | $30,000 | $83,830 |
Source: Public Records
Map
Nearby Homes
- 7740 Shalimar St
- 7952 Shalimar St
- 7969 Ramona St
- 7820 Orleans St
- 7655 Tropicana St
- 7642 Venetian St
- 7637 Tropicana St
- 2110 Gulfstream Dr
- 2401 Largo Dr
- 2270 Havana Dr
- 2261 Utopia Dr
- 7600 Venetian St
- 8051 SW 21st Ct Unit 8051
- 7612 Plantation Blvd
- 2431 Sabal Palm Dr
- 8053 SW 21st Ct Unit 8053
- 2273 SW 80th Terrace Unit 2273
- 2249 SW 80th Terrace Unit 2249
- 8109 SW 21st Ct Unit 8109
- 7531 Tropicana St
- 7820 Venetian St
- 7828 Venetian St
- 7825 Tropicana St
- 7821 Tropicana St
- 7816 Venetian St
- 7829 Tropicana St
- 7832 Venetian St
- 7825 Venetian St
- 7817 Tropicana St
- 7833 Tropicana St
- 7821 Venetian St
- 7829 Venetian St
- 7812 Venetian St
- 7836 Venetian St
- 7833 Venetian St
- 7817 Venetian St
- 7813 Tropicana St
- 7837 Tropicana St
- 7848 Pembroke Rd
- 7813 Venetian St