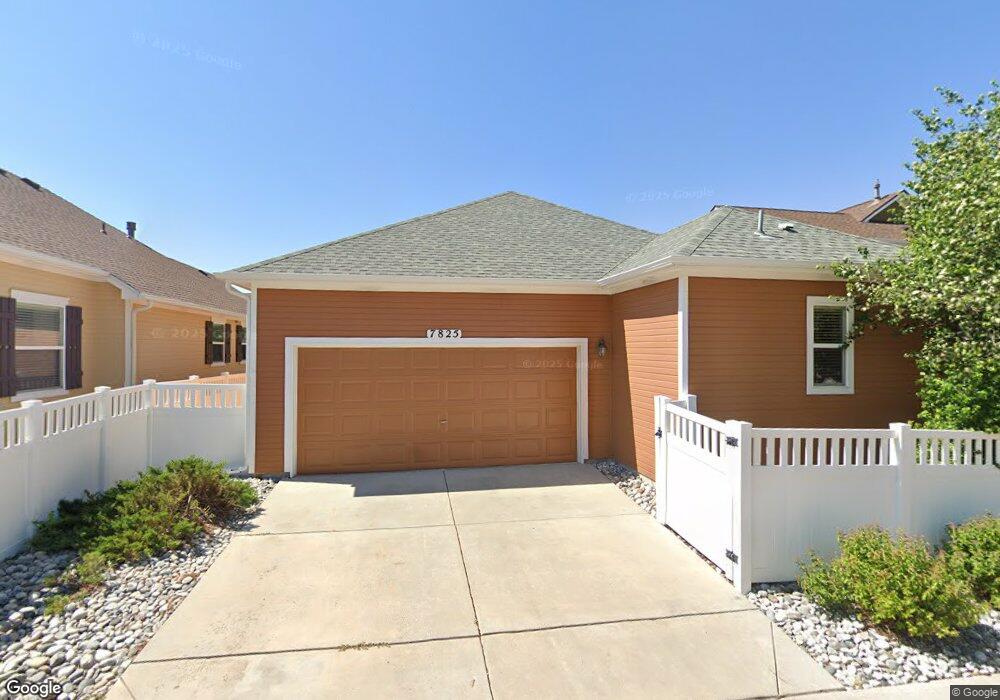
7825 Bengali Ln Colorado Springs, CO 80923
Ridgeview NeighborhoodEstimated Value: $391,905 - $408,000
2
Beds
1
Bath
1,300
Sq Ft
$306/Sq Ft
Est. Value
About This Home
This home is located at 7825 Bengali Ln, Colorado Springs, CO 80923 and is currently estimated at $397,226, approximately $305 per square foot. 7825 Bengali Ln is a home located in El Paso County with nearby schools including Stetson Elementary School, Skyview Middle School, and Sand Creek High School.
Ownership History
Date
Name
Owned For
Owner Type
Purchase Details
Closed on
Apr 23, 2021
Sold by
Hollock Amy M
Bought by
Small John K and Small Brenda K
Current Estimated Value
Home Financials for this Owner
Home Financials are based on the most recent Mortgage that was taken out on this home.
Original Mortgage
$261,375
Outstanding Balance
$236,367
Interest Rate
3.1%
Mortgage Type
New Conventional
Estimated Equity
$160,859
Purchase Details
Closed on
Mar 31, 2009
Sold by
Wood Julian G and Wood Phoebe A
Bought by
Hallock Amy M
Home Financials for this Owner
Home Financials are based on the most recent Mortgage that was taken out on this home.
Original Mortgage
$173,665
Interest Rate
5.14%
Mortgage Type
VA
Purchase Details
Closed on
Aug 2, 2007
Sold by
Elite Properties Of America Inc
Bought by
Wood Julian G and Wood Phoebe A
Home Financials for this Owner
Home Financials are based on the most recent Mortgage that was taken out on this home.
Original Mortgage
$30,000
Interest Rate
6.73%
Mortgage Type
Credit Line Revolving
Create a Home Valuation Report for This Property
The Home Valuation Report is an in-depth analysis detailing your home's value as well as a comparison with similar homes in the area
Home Values in the Area
Average Home Value in this Area
Purchase History
| Date | Buyer | Sale Price | Title Company |
|---|---|---|---|
| Small John K | $348,500 | Wfg National Title | |
| Hallock Amy M | $170,000 | Empire Title Co Springs Llc | |
| Wood Julian G | $206,575 | -- |
Source: Public Records
Mortgage History
| Date | Status | Borrower | Loan Amount |
|---|---|---|---|
| Open | Small John K | $261,375 | |
| Previous Owner | Hallock Amy M | $173,665 | |
| Previous Owner | Wood Julian G | $30,000 |
Source: Public Records
Tax History Compared to Growth
Tax History
| Year | Tax Paid | Tax Assessment Tax Assessment Total Assessment is a certain percentage of the fair market value that is determined by local assessors to be the total taxable value of land and additions on the property. | Land | Improvement |
|---|---|---|---|---|
| 2025 | $2,045 | $28,260 | -- | -- |
| 2024 | $2,156 | $28,320 | $4,620 | $23,700 |
| 2023 | $2,156 | $28,320 | $4,620 | $23,700 |
| 2022 | $1,788 | $19,660 | $4,170 | $15,490 |
| 2021 | $1,875 | $20,230 | $4,290 | $15,940 |
| 2020 | $1,517 | $17,450 | $3,580 | $13,870 |
| 2019 | $1,506 | $17,450 | $3,580 | $13,870 |
| 2018 | $1,220 | $13,970 | $3,020 | $10,950 |
| 2017 | $1,224 | $13,970 | $3,020 | $10,950 |
| 2016 | $1,185 | $13,780 | $2,950 | $10,830 |
| 2015 | $1,186 | $13,780 | $2,950 | $10,830 |
| 2014 | $1,084 | $12,420 | $2,790 | $9,630 |
Source: Public Records
Map
Nearby Homes
- 7583 Manistique Dr
- 5718 Badenoch Terrace
- 7678 Calypso Dr
- 7525 Stetson Highlands Dr
- 7674 Stetson Highlands Dr
- 7882 Tango Ln
- 7533 Amberly Dr
- 6078 Jorie Rd
- 5477 Passport View
- 5440 Necker Heights
- 5466 Arden Grove
- 6081 Anders Ridge Ln
- 7368 Prythania Park Dr
- 5352 Freeboot Point
- 7340 Amberly Dr
- 5309 Passport View
- 5919 Brennan Ave
- 6131 Anders Ridge Ln
- 5889 Brennan Ave
- 7737 Desert Wind Dr
- 7817 Bengali Ln
- 7809 Bengali Ln
- 7841 Bengali Ln
- 7824 Bengali Ln
- 7824R Bengali Ln
- 7832 Bengali Ln
- 7816 Bengali Ln
- 7873 Bengali Ln
- 7881 Bengali Ln
- 7840 Bengali Ln
- 7865 Bengali Ln
- 7808 Bengali Ln
- 7857 Bengali Ln
- 7889 Bengali Ln
- 7848 Bengali Ln
- 7872 Bengali Ln
- 7880 Bengali Ln
- 5762 Cassina Dr
- 7864 Bengali Ln
- 7888 Bengali Ln