Estimated Value: $283,000 - $370,000
4
Beds
2
Baths
2,162
Sq Ft
$145/Sq Ft
Est. Value
About This Home
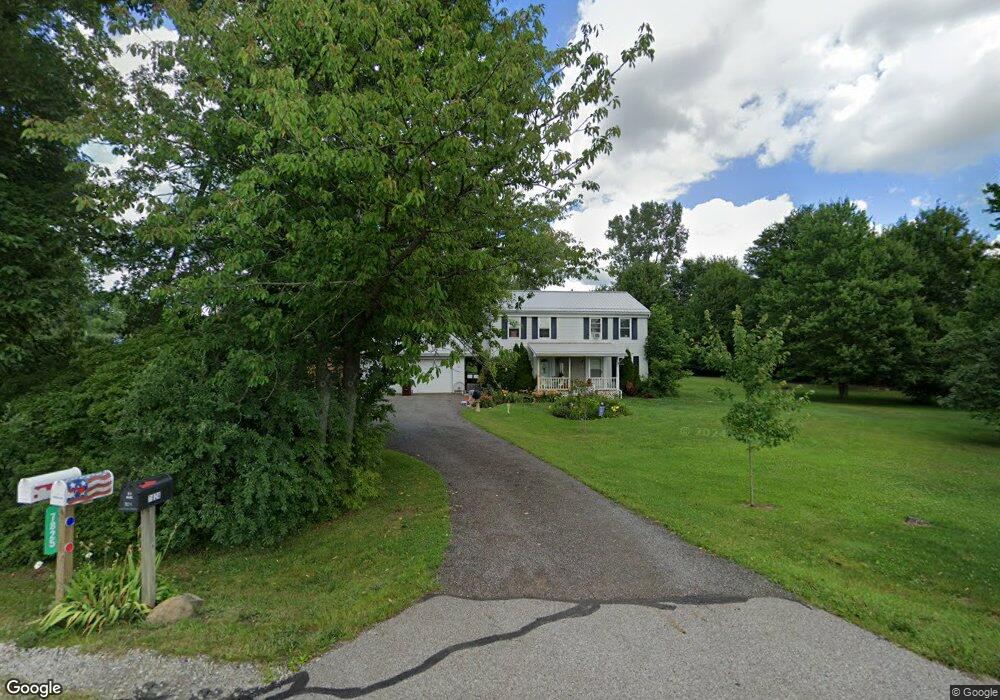
This home is located at 7825 Greenwich Rd, Lodi, OH 44254 and is currently estimated at $313,751, approximately $145 per square foot. 7825 Greenwich Rd is a home located in Medina County with nearby schools including Cloverleaf Elementary School, Cloverleaf Middle School, and Cloverleaf High School.
Ownership History
Date
Name
Owned For
Owner Type
Purchase Details
Closed on
Sep 27, 2016
Sold by
Campbell Jonathan W
Bought by
Campbell Jonathan W and Campbell Priscilla
Current Estimated Value
Home Financials for this Owner
Home Financials are based on the most recent Mortgage that was taken out on this home.
Original Mortgage
$139,363
Outstanding Balance
$111,584
Interest Rate
3.42%
Mortgage Type
FHA
Estimated Equity
$202,167
Purchase Details
Closed on
Oct 25, 2005
Sold by
Hoops Dennis C
Bought by
Campbell Jonathan W
Home Financials for this Owner
Home Financials are based on the most recent Mortgage that was taken out on this home.
Original Mortgage
$171,557
Interest Rate
5.8%
Mortgage Type
FHA
Purchase Details
Closed on
Jun 11, 2005
Sold by
Wilson Margaret Hoops
Bought by
Hoops Dennis C
Create a Home Valuation Report for This Property
The Home Valuation Report is an in-depth analysis detailing your home's value as well as a comparison with similar homes in the area
Home Values in the Area
Average Home Value in this Area
Purchase History
| Date | Buyer | Sale Price | Title Company |
|---|---|---|---|
| Campbell Jonathan W | -- | Servicelink Division | |
| Campbell Jonathan W | $174,300 | -- | |
| Hoops Dennis C | -- | Ltic |
Source: Public Records
Mortgage History
| Date | Status | Borrower | Loan Amount |
|---|---|---|---|
| Open | Campbell Jonathan W | $139,363 | |
| Closed | Campbell Jonathan W | $171,557 |
Source: Public Records
Tax History Compared to Growth
Tax History
| Year | Tax Paid | Tax Assessment Tax Assessment Total Assessment is a certain percentage of the fair market value that is determined by local assessors to be the total taxable value of land and additions on the property. | Land | Improvement |
|---|---|---|---|---|
| 2024 | $2,790 | $73,720 | $21,980 | $51,740 |
| 2023 | $2,790 | $73,720 | $21,980 | $51,740 |
| 2022 | $2,872 | $73,720 | $21,980 | $51,740 |
| 2021 | $2,420 | $56,270 | $16,780 | $39,490 |
| 2020 | $2,464 | $56,270 | $16,780 | $39,490 |
| 2019 | $2,479 | $56,270 | $16,780 | $39,490 |
| 2018 | $2,278 | $49,720 | $15,140 | $34,580 |
| 2017 | $2,188 | $49,720 | $15,140 | $34,580 |
| 2016 | $2,218 | $49,720 | $15,140 | $34,580 |
| 2015 | $2,156 | $46,900 | $14,280 | $32,620 |
| 2014 | $2,147 | $46,900 | $14,280 | $32,620 |
| 2013 | $1,985 | $46,900 | $14,280 | $32,620 |
Source: Public Records
Map
Nearby Homes
- 7595 Kings Creek Dr
- 0 Greenwich Rd Unit 5170888
- 7101 Greenwich Rd
- 106 Anderson Cove Unit 206
- 7009 Greenwich Rd
- 403 Young Dr
- 6895 Grant Dr
- 720 Medina St
- 221 N Market St
- 8849 Concord Dr
- 133 S Broadway St
- 108 River St
- 125 Bank St
- 7908 Garman Rd
- 8123 Vandemark Rd
- 8525 Broxton Ct
- 40 Oakwood Dr
- 0 Cemetery Rd
- 131 Mill St
- 7660 Vandemark Rd
- 7839 Greenwich Rd
- 7824 Greenwich Rd
- 7859 Greenwich Rd
- 7836 Greenwich Rd
- 7836 Greenwich Rd
- 7777 Greenwich Rd
- 7879 Greenwich Rd
- 7899 Greenwich Rd
- 7904 Greenwich Rd
- 7915 Greenwich Rd
- 7723 Greenwich Rd
- 7732 Greenwich Rd
- 7769 Greenwich Rd
- 7953 Greenwich Rd
- 7950 Greenwich Rd
- 7700 Greenwich Rd
- 7695 Greenwich Rd
- 9030 Friendsville Rd
- 9038 Friendsville Rd
- 7979 Greenwich Rd