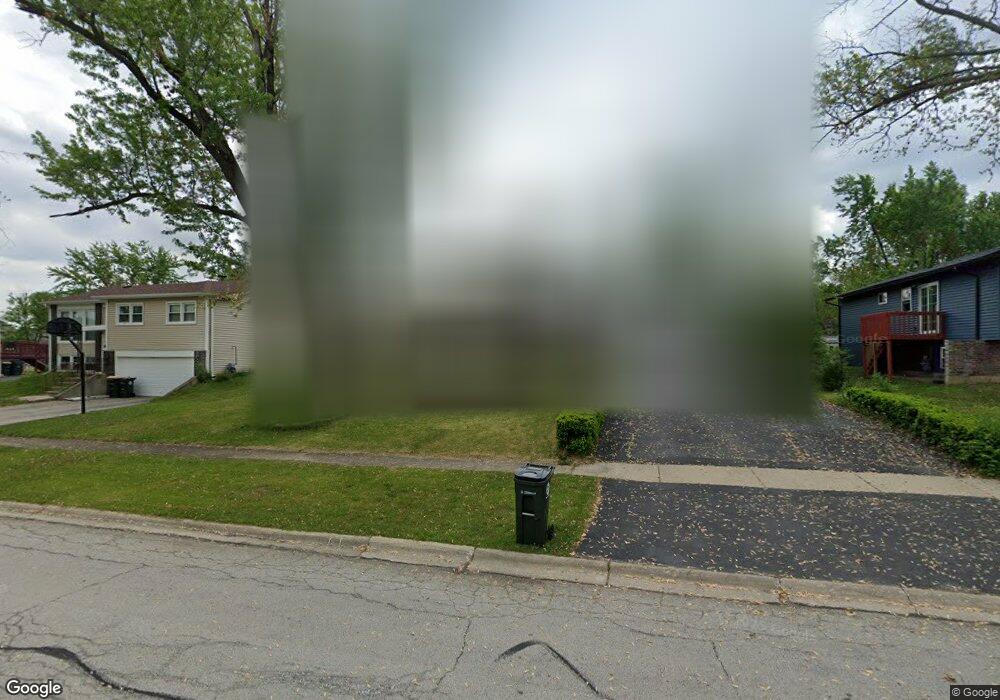
7825 Valley View Ln Woodridge, IL 60517
West 83rd NeighborhoodEstimated Value: $310,000 - $378,000
--
Bed
1
Bath
1,175
Sq Ft
$297/Sq Ft
Est. Value
About This Home
This home is located at 7825 Valley View Ln, Woodridge, IL 60517 and is currently estimated at $348,715, approximately $296 per square foot. 7825 Valley View Ln is a home located in DuPage County with nearby schools including William F. Murphy Elementary School, Thomas Jefferson Junior High School, and Downers Grove South High School.
Ownership History
Date
Name
Owned For
Owner Type
Purchase Details
Closed on
Nov 12, 2015
Sold by
Cyriac Tompaul and Thomas Litty M
Bought by
Jayarani Joseph Mathew and Jayarani Mathew
Current Estimated Value
Home Financials for this Owner
Home Financials are based on the most recent Mortgage that was taken out on this home.
Original Mortgage
$112,500
Outstanding Balance
$89,466
Interest Rate
4.12%
Mortgage Type
New Conventional
Estimated Equity
$259,249
Purchase Details
Closed on
Oct 11, 2001
Sold by
Cyriac Tompaul and Cyriac Joseph
Bought by
Cyriac Tompaul and Thomas Litty M
Purchase Details
Closed on
Apr 5, 1994
Sold by
Mcauliffe Thomas J and Mcauliffe Mirna
Bought by
Cyriac Joseph and Cyriac Tompaul K
Home Financials for this Owner
Home Financials are based on the most recent Mortgage that was taken out on this home.
Original Mortgage
$91,600
Interest Rate
7.35%
Create a Home Valuation Report for This Property
The Home Valuation Report is an in-depth analysis detailing your home's value as well as a comparison with similar homes in the area
Home Values in the Area
Average Home Value in this Area
Purchase History
| Date | Buyer | Sale Price | Title Company |
|---|---|---|---|
| Jayarani Joseph Mathew | $150,000 | First American Title | |
| Cyriac Tompaul | -- | Law Title Insurance | |
| Cyriac Joseph | $114,500 | Attorneys Title Guaranty Fun |
Source: Public Records
Mortgage History
| Date | Status | Borrower | Loan Amount |
|---|---|---|---|
| Open | Jayarani Joseph Mathew | $112,500 | |
| Previous Owner | Cyriac Joseph | $91,600 |
Source: Public Records
Tax History Compared to Growth
Tax History
| Year | Tax Paid | Tax Assessment Tax Assessment Total Assessment is a certain percentage of the fair market value that is determined by local assessors to be the total taxable value of land and additions on the property. | Land | Improvement |
|---|---|---|---|---|
| 2024 | $7,740 | $103,511 | $55,322 | $48,189 |
| 2023 | $7,383 | $94,470 | $50,490 | $43,980 |
| 2022 | $7,266 | $90,840 | $48,550 | $42,290 |
| 2021 | $6,926 | $86,970 | $46,710 | $40,260 |
| 2020 | $6,823 | $85,410 | $45,870 | $39,540 |
| 2019 | $6,610 | $81,720 | $43,890 | $37,830 |
| 2018 | $6,243 | $75,000 | $40,280 | $34,720 |
| 2017 | $6,069 | $72,470 | $38,920 | $33,550 |
| 2016 | $5,956 | $69,850 | $37,510 | $32,340 |
| 2015 | $5,854 | $65,770 | $35,320 | $30,450 |
| 2014 | $5,796 | $63,400 | $34,050 | $29,350 |
| 2013 | $5,706 | $63,550 | $34,130 | $29,420 |
Source: Public Records
Map
Nearby Homes
- 2302 Dalewood Pkwy
- 2110 Country Club Dr Unit 197F
- 2546 Jonquil Ln
- 7836 Catalpa Ave
- 8202 Piers Dr Unit 1302
- 2220 Wharf Dr Unit 1906
- 2212 Wharf Dr Unit 2102
- 7664 Willow Ave
- 2033 Westbury Dr
- 7660 Walnut Ave
- 1807 Nottingham Rd
- 2732 Davos Ave
- Lot 006 Woodward Ave
- 8040 Geneva St
- 2721 Zurich Ln
- 3 Oakview Ct
- 649 Sheffield Ln
- 2605 Willow Ave
- 8327 Chelsea Ln
- 2852 Everglade Ave
- 7821 Valley View Ln
- 7829 Valley View Ln
- 7817 Valley View Ln
- 7824 Valley View Ln
- 7820 Hiawatha Pkwy
- 7824 Hiawatha Pkwy
- 2230 Birchwood Pkwy
- 7820 Valley View Ln
- 2234 Birchwood Pkwy
- 7828 Hiawatha Pkwy
- 7828 Valley View Ln
- 2227 Evergreen Ln
- 7816 Valley View Ln
- 2220 Hiawatha Pkwy
- 7832 Valley View Ln
- 2223 Evergreen Ln
- 7812 Valley View Ln
- 7836 Valley View Ln
- 7817 Dalewood Pkwy
- 7829 Hiawatha Pkwy