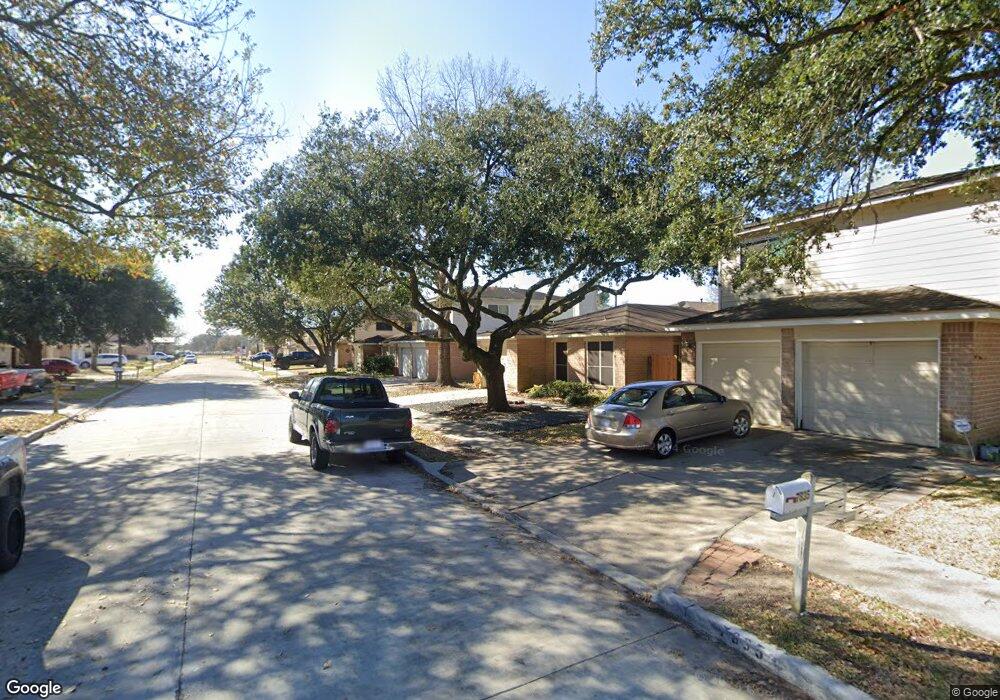
7827 Hillbarn Dr Houston, TX 77040
North Houston NeighborhoodEstimated Value: $187,108 - $249,000
3
Beds
3
Baths
1,416
Sq Ft
$154/Sq Ft
Est. Value
About This Home
This home is located at 7827 Hillbarn Dr, Houston, TX 77040 and is currently estimated at $218,277, approximately $154 per square foot. 7827 Hillbarn Dr is a home located in Harris County with nearby schools including Reed Elementary School, Dean Middle School, and Jersey Village High School.
Ownership History
Date
Name
Owned For
Owner Type
Purchase Details
Closed on
Feb 15, 2010
Sold by
Sample Julie
Bought by
Valverde Paul V and Valverde Marianne
Current Estimated Value
Home Financials for this Owner
Home Financials are based on the most recent Mortgage that was taken out on this home.
Original Mortgage
$89,500
Outstanding Balance
$28,229
Interest Rate
5.11%
Mortgage Type
Seller Take Back
Estimated Equity
$190,048
Purchase Details
Closed on
Dec 28, 2007
Sold by
Welch George and Welch Tina
Bought by
Sample Julie
Purchase Details
Closed on
Aug 31, 1993
Sold by
Bidwell Joy H Westgard and Bidwell William T
Bought by
Welch George
Home Financials for this Owner
Home Financials are based on the most recent Mortgage that was taken out on this home.
Original Mortgage
$51,050
Interest Rate
7.23%
Create a Home Valuation Report for This Property
The Home Valuation Report is an in-depth analysis detailing your home's value as well as a comparison with similar homes in the area
Home Values in the Area
Average Home Value in this Area
Purchase History
| Date | Buyer | Sale Price | Title Company |
|---|---|---|---|
| Valverde Paul V | -- | Stewart Title Houston Div | |
| Sample Julie | -- | Stewart Title Houston Div | |
| Welch George | -- | -- |
Source: Public Records
Mortgage History
| Date | Status | Borrower | Loan Amount |
|---|---|---|---|
| Open | Valverde Paul V | $89,500 | |
| Previous Owner | Welch George | $51,050 |
Source: Public Records
Tax History Compared to Growth
Tax History
| Year | Tax Paid | Tax Assessment Tax Assessment Total Assessment is a certain percentage of the fair market value that is determined by local assessors to be the total taxable value of land and additions on the property. | Land | Improvement |
|---|---|---|---|---|
| 2025 | $1,763 | $156,736 | $44,616 | $112,120 |
| 2024 | $1,763 | $152,170 | $38,808 | $113,362 |
| 2023 | $1,763 | $214,201 | $38,808 | $175,393 |
| 2022 | $3,755 | $169,064 | $32,340 | $136,724 |
| 2021 | $3,611 | $149,873 | $32,340 | $117,533 |
| 2020 | $3,400 | $141,922 | $23,100 | $118,822 |
| 2019 | $3,191 | $131,931 | $21,384 | $110,547 |
| 2018 | $1,863 | $118,000 | $21,384 | $96,616 |
| 2017 | $2,648 | $121,186 | $21,384 | $99,802 |
| 2016 | $2,407 | $97,600 | $14,256 | $83,344 |
| 2015 | $1,473 | $97,637 | $14,256 | $83,381 |
| 2014 | $1,473 | $73,500 | $11,880 | $61,620 |
Source: Public Records
Map
Nearby Homes
- 7823 Redlands Dr
- 8403 Cienna Dr
- 7802 Percussion Place
- 8315 Whisper Point Dr
- 8715 Andante Dr
- 8315 Terrace Brook Dr
- 8115 Oahu Ct
- 8006 Summer Trail Dr
- 7915 Corrian Park Cir
- 8126 Ivan Reid Dr
- 8202 Terrace Brook Dr
- 8111 Ivan Reid Dr
- 8418 Westnut Ln
- 8131 Debbie Gay Dr
- 7926 Westington Ln
- 7410 Wood Bluff Blvd
- 7918 Battleoak Dr
- 10515 Ince Ln
- 8331 Westbank Ave
- 7911 Battleoak Dr
- 7831 Hillbarn Dr
- 7823 Hillbarn Dr
- 7830 Redlands Dr
- 7834 Redlands Dr
- 7819 Hillbarn Dr
- 7826 Redlands Dr
- 7835 Hillbarn Dr
- 7838 Redlands Dr
- 7822 Redlands Dr
- 7815 Hillbarn Dr
- 7830 Hillbarn Dr
- 7826 Hillbarn Dr
- 7834 Hillbarn Dr
- 7822 Hillbarn Dr
- 7818 Redlands Dr
- 7838 Hillbarn Dr
- 7818 Hillbarn Dr
- 7811 Hillbarn Dr
- 7814 Redlands Dr
- 7842 Hillbarn Dr