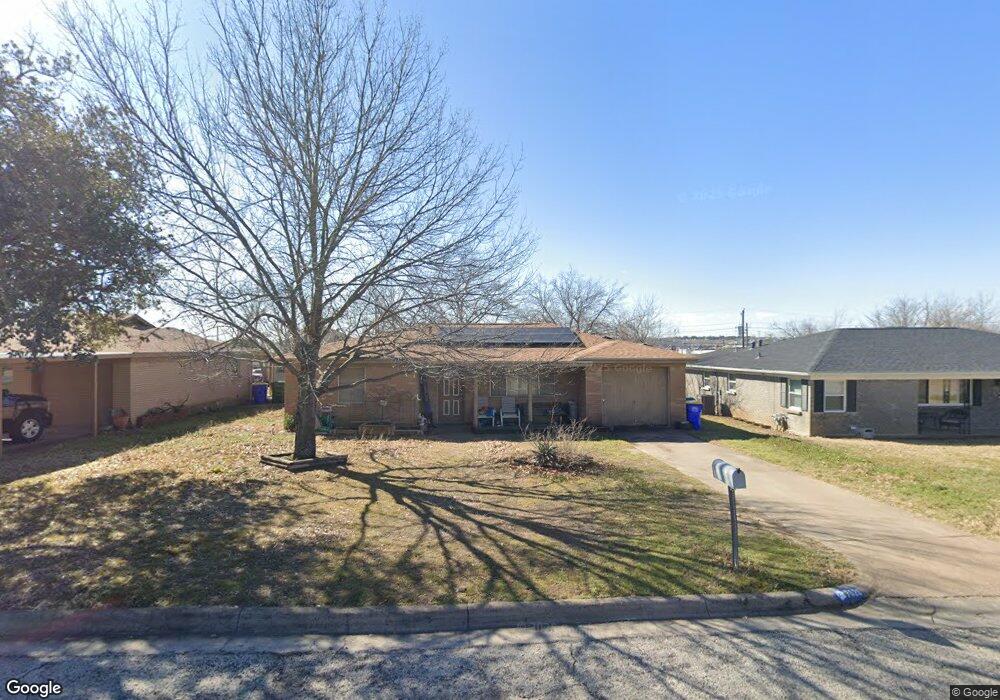
7829 Abbott Dr Fort Worth, TX 76108
Estimated Value: $190,000 - $238,000
3
Beds
2
Baths
1,079
Sq Ft
$195/Sq Ft
Est. Value
About This Home
This home is located at 7829 Abbott Dr, Fort Worth, TX 76108 and is currently estimated at $210,412, approximately $195 per square foot. 7829 Abbott Dr is a home located in Tarrant County with nearby schools including Liberty Elementary School, Brewer Middle School, and Tannahill Intermediate School.
Ownership History
Date
Name
Owned For
Owner Type
Purchase Details
Closed on
Feb 4, 2021
Sold by
Herron Tammie Stewart and Herron Michael Leroy
Bought by
Herron Michael Leroy and Herron Tammie Stewart
Current Estimated Value
Home Financials for this Owner
Home Financials are based on the most recent Mortgage that was taken out on this home.
Original Mortgage
$124,000
Outstanding Balance
$107,050
Interest Rate
2.7%
Mortgage Type
New Conventional
Estimated Equity
$103,362
Purchase Details
Closed on
May 12, 1995
Sold by
Stewart Michael Douglas
Bought by
Stewart Tammie Elain
Create a Home Valuation Report for This Property
The Home Valuation Report is an in-depth analysis detailing your home's value as well as a comparison with similar homes in the area
Home Values in the Area
Average Home Value in this Area
Purchase History
| Date | Buyer | Sale Price | Title Company |
|---|---|---|---|
| Herron Michael Leroy | -- | Timios Inc | |
| Stewart Tammie Elain | -- | -- |
Source: Public Records
Mortgage History
| Date | Status | Borrower | Loan Amount |
|---|---|---|---|
| Open | Herron Michael Leroy | $124,000 |
Source: Public Records
Tax History
| Year | Tax Paid | Tax Assessment Tax Assessment Total Assessment is a certain percentage of the fair market value that is determined by local assessors to be the total taxable value of land and additions on the property. | Land | Improvement |
|---|---|---|---|---|
| 2025 | $2,590 | $178,284 | $43,615 | $134,669 |
| 2024 | $2,590 | $178,284 | $43,615 | $134,669 |
| 2023 | $4,693 | $197,363 | $43,615 | $153,748 |
| 2022 | $3,941 | $145,542 | $25,000 | $120,542 |
| 2021 | $2,607 | $136,493 | $25,000 | $111,493 |
| 2020 | $2,387 | $119,848 | $25,000 | $94,848 |
| 2019 | $2,253 | $120,743 | $25,000 | $95,743 |
| 2018 | $1,560 | $71,209 | $12,000 | $59,209 |
| 2017 | $1,892 | $95,671 | $12,000 | $83,671 |
| 2016 | $1,720 | $60,828 | $12,000 | $48,828 |
| 2015 | $1,232 | $53,500 | $9,000 | $44,500 |
| 2014 | $1,232 | $53,500 | $9,000 | $44,500 |
Source: Public Records
Map
Nearby Homes
- 7704 Carlos St
- 7721 Colton Dr
- 7940 Chaparral Dr
- 8016 Downe Dr
- 1601 Mary k Ln
- 7836 Corina Dr
- 1201 Kimbrough St
- 852 Odie Dr
- 8105 Downe Dr
- 872 June Dr
- 8141 Tumbleweed Trail
- 730 S Cherry Ln
- 8224 Carlos St
- 00000 West Fwy
- 8237 Albert St
- 604 Kimbrough St
- 2932 Fox Trail Ln
- 2933 Dixondale Dr
- 500 Crandle Dr
- 501 Odie Dr
Your Personal Tour Guide
Ask me questions while you tour the home.