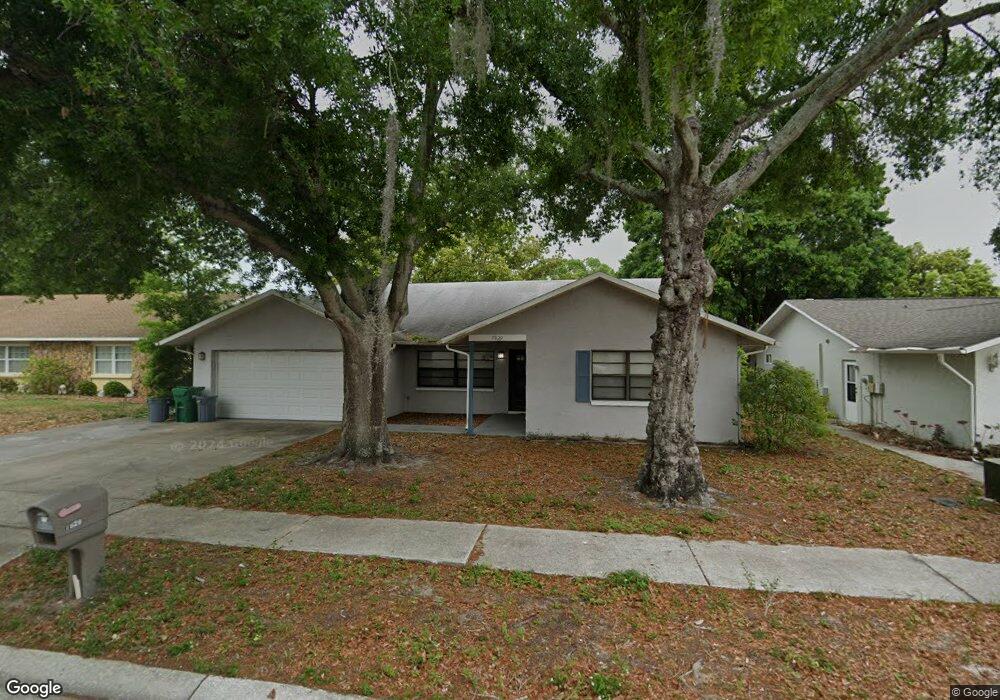
7829 Exuma Ave Port Richey, FL 34668
Estimated Value: $273,000 - $364,000
3
Beds
2
Baths
2,882
Sq Ft
$112/Sq Ft
Est. Value
About This Home
This home is located at 7829 Exuma Ave, Port Richey, FL 34668 and is currently estimated at $322,287, approximately $111 per square foot. 7829 Exuma Ave is a home located in Pasco County with nearby schools including Chasco Elementary School, Chasco Middle School, and Fivay High School.
Ownership History
Date
Name
Owned For
Owner Type
Purchase Details
Closed on
Jan 27, 2017
Sold by
Wilmintgton Svings Fund Socity Fsb
Bought by
Sf 16 Llc
Current Estimated Value
Purchase Details
Closed on
Oct 24, 2016
Sold by
The Estate Of James R Willey
Bought by
Wilmington Savings Fund Society
Purchase Details
Closed on
Mar 22, 1999
Sold by
Willey James R and Willey Cheryl D
Bought by
Willey James R
Purchase Details
Closed on
Aug 4, 1998
Sold by
Looney Michael D and Looney Karen J
Bought by
Willey James R and Willey Cheryl D
Home Financials for this Owner
Home Financials are based on the most recent Mortgage that was taken out on this home.
Original Mortgage
$77,900
Interest Rate
6.94%
Mortgage Type
New Conventional
Purchase Details
Closed on
Jun 24, 1997
Sold by
Grey Frank I and Grey Dheryl A
Bought by
Looney Karen J and Looney Michael D
Home Financials for this Owner
Home Financials are based on the most recent Mortgage that was taken out on this home.
Original Mortgage
$70,000
Interest Rate
7.97%
Mortgage Type
New Conventional
Create a Home Valuation Report for This Property
The Home Valuation Report is an in-depth analysis detailing your home's value as well as a comparison with similar homes in the area
Home Values in the Area
Average Home Value in this Area
Purchase History
| Date | Buyer | Sale Price | Title Company |
|---|---|---|---|
| Sf 16 Llc | $118,000 | First International Title In | |
| Wilmington Savings Fund Society | $120,100 | None Available | |
| Willey James R | $100 | -- | |
| Willey James R | $86,700 | -- | |
| Looney Karen J | $82,000 | -- |
Source: Public Records
Mortgage History
| Date | Status | Borrower | Loan Amount |
|---|---|---|---|
| Previous Owner | Looney Karen J | $90,000 | |
| Previous Owner | Looney Karen J | $20,800 | |
| Previous Owner | Looney Karen J | $77,900 | |
| Previous Owner | Looney Karen J | $70,000 |
Source: Public Records
Tax History Compared to Growth
Tax History
| Year | Tax Paid | Tax Assessment Tax Assessment Total Assessment is a certain percentage of the fair market value that is determined by local assessors to be the total taxable value of land and additions on the property. | Land | Improvement |
|---|---|---|---|---|
| 2025 | $4,375 | $297,118 | $46,970 | $250,148 |
| 2024 | $4,375 | $272,080 | $42,700 | $229,380 |
| 2023 | $4,203 | $207,350 | $0 | $0 |
| 2022 | $3,465 | $241,023 | $29,680 | $211,343 |
| 2021 | $2,971 | $176,316 | $26,600 | $149,716 |
| 2020 | $2,695 | $155,791 | $12,950 | $142,841 |
| 2019 | $2,621 | $150,016 | $12,950 | $137,066 |
| 2018 | $2,478 | $141,036 | $12,950 | $128,086 |
| 2017 | $2,222 | $122,798 | $12,950 | $109,848 |
| 2016 | $2,032 | $112,986 | $12,950 | $100,036 |
| 2015 | $154 | $106,743 | $12,250 | $94,493 |
| 2014 | $144 | $102,361 | $12,250 | $90,111 |
Source: Public Records
Map
Nearby Homes
- 8910 Elm Leaf Ct
- 9005 Hermitage Ln
- 9020 Lunar Ln
- 8742 Bermuda Ln
- 9100 Lunar Ln
- 9050 Richwood Ln
- 9116 Gray Fox Ln
- 8744 Andros Ln
- 8730 Martinique Ln
- 9136 Mark Twain Ln
- 9131 Hunt Club Ln
- 9201 Hunt Club Ln
- 9125 Lunar Ln
- 9105 Chantilly Ln
- 7822 Bahama Ave
- 7624 Lake Forest Cir
- 7438 Lake Forest Cir
- 7933 Radcliffe Cir
- 9100 Suffolk Ln
- 7923 Radcliffe Cir
- 7821 Exuma Ave
- 7837 Exuma Ave
- 7828 San Miguel Dr
- 7834 San Miguel Dr
- 7820 San Miguel Dr
- 7815 Exuma Ave
- 8923 Greenleaf Ct
- 7845 Exuma Ave
- 8922 Bermuda Ln
- 8949 Mark Twain Ln
- 7814 San Miguel Dr
- 7807 Exuma Ave
- 8922 Greenleaf Ct
- 8915 Greenleaf Ct
- 8914 Bermuda Ln
- 7806 San Miguel Dr
- 9006 Collage Ln
- 9005 Collage Ln
- 8914 Greenleaf Ct
- 8923 Bermuda Ln