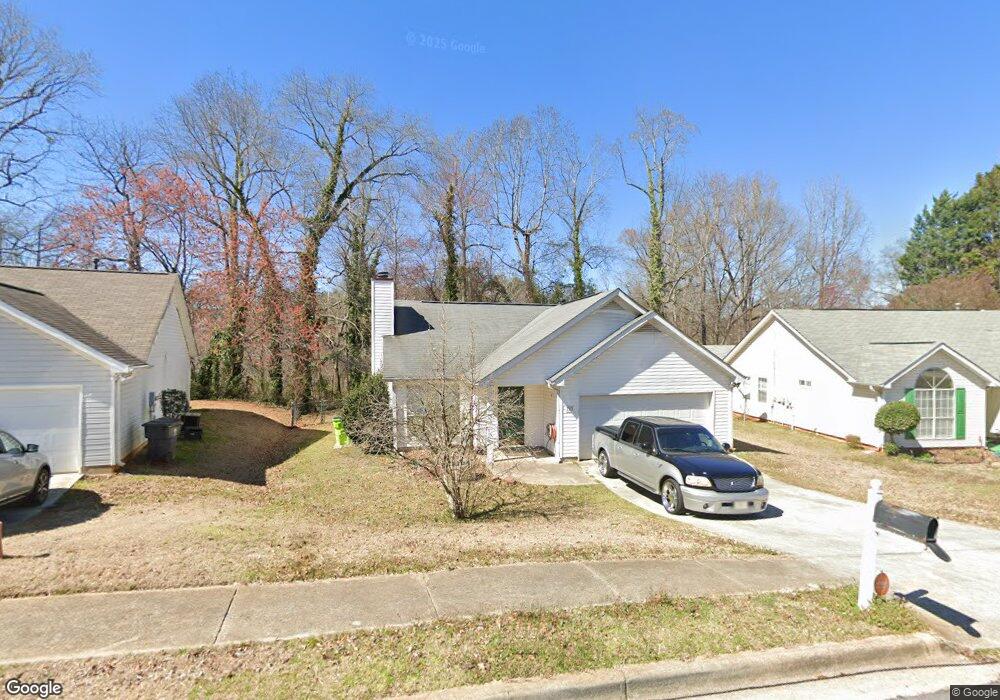
783 Beaver Run Trace Unit I McDonough, GA 30253
Estimated Value: $228,504 - $244,000
3
Beds
2
Baths
1,344
Sq Ft
$177/Sq Ft
Est. Value
About This Home
This home is located at 783 Beaver Run Trace Unit I, McDonough, GA 30253 and is currently estimated at $237,376, approximately $176 per square foot. 783 Beaver Run Trace Unit I is a home located in Henry County with nearby schools including Walnut Creek Elementary School, McDonough Middle School, and McDonough Methodist Academy.
Ownership History
Date
Name
Owned For
Owner Type
Purchase Details
Closed on
Sep 12, 2011
Sold by
Secretary Of Housing And U
Bought by
Moultrie Jerome D
Current Estimated Value
Home Financials for this Owner
Home Financials are based on the most recent Mortgage that was taken out on this home.
Original Mortgage
$44,339
Outstanding Balance
$30,479
Interest Rate
4.34%
Mortgage Type
FHA
Estimated Equity
$206,897
Purchase Details
Closed on
Jun 7, 2011
Sold by
Wells Fargo Bk Na
Bought by
Hud-Housing Of Urban Dev
Purchase Details
Closed on
Jan 31, 2001
Sold by
Newman Kyle and Newman Tammy L
Bought by
Daino James A
Home Financials for this Owner
Home Financials are based on the most recent Mortgage that was taken out on this home.
Original Mortgage
$106,061
Interest Rate
7.18%
Mortgage Type
FHA
Purchase Details
Closed on
Dec 14, 1995
Sold by
Johnsoncommun Hayes
Bought by
Newman Kyle
Create a Home Valuation Report for This Property
The Home Valuation Report is an in-depth analysis detailing your home's value as well as a comparison with similar homes in the area
Home Values in the Area
Average Home Value in this Area
Purchase History
| Date | Buyer | Sale Price | Title Company |
|---|---|---|---|
| Moultrie Jerome D | $44,000 | -- | |
| Hud-Housing Of Urban Dev | -- | -- | |
| Wells Fargo Bk Na | $97,813 | -- | |
| Daino James A | $106,900 | -- | |
| Newman Kyle | $86,400 | -- |
Source: Public Records
Mortgage History
| Date | Status | Borrower | Loan Amount |
|---|---|---|---|
| Open | Moultrie Jerome D | $44,339 | |
| Previous Owner | Daino James A | $106,061 | |
| Closed | Newman Kyle | $0 |
Source: Public Records
Tax History Compared to Growth
Tax History
| Year | Tax Paid | Tax Assessment Tax Assessment Total Assessment is a certain percentage of the fair market value that is determined by local assessors to be the total taxable value of land and additions on the property. | Land | Improvement |
|---|---|---|---|---|
| 2025 | $3,898 | $97,600 | $14,000 | $83,600 |
| 2024 | $3,898 | $92,000 | $14,000 | $78,000 |
| 2023 | $3,574 | $92,120 | $12,000 | $80,120 |
| 2022 | $2,803 | $72,040 | $12,000 | $60,040 |
| 2021 | $2,338 | $59,920 | $12,000 | $47,920 |
| 2020 | $2,039 | $52,120 | $8,000 | $44,120 |
| 2019 | $1,982 | $50,640 | $8,000 | $42,640 |
| 2018 | $1,473 | $37,360 | $6,000 | $31,360 |
| 2016 | $1,373 | $34,760 | $6,000 | $28,760 |
| 2015 | $1,207 | $29,520 | $6,000 | $23,520 |
| 2014 | $1,109 | $26,720 | $6,000 | $20,720 |
Source: Public Records
Map
Nearby Homes
- 922 Sweetwater Way
- 1315 Sweetwater Ct
- 121 Weldon Rd Unit 65
- 112 Weldon Rd
- 125 Weldon Rd Unit 64
- 116 Weldon Rd
- 136 Weldon Rd Unit 10
- 136 Weldon Rd
- 333 Fallview Dr
- 161 Weldon Rd
- 161 Weldon Rd Unit 55
- 328 Fallview Dr
- 122 Lake Terrace
- 435 Rosehill Dr
- 402 Leslie Ct
- 605 Keaton Ct
- 20 Rosebud Ln
- 808 Cambridge Way
- 113 Burleyson Dr Unit 1
- 316 Sierra Ct
- 783 Beaver Run Trace
- 779 Beaver Run Trace Unit I
- 787 Beaver Run Trace
- 787 Beaver Run Trace
- 771 Beaver Run Trace
- 789 Beaver Run Trace Unit I
- 1314 Sweetwater Ct
- 786 Beaver Run Trace
- 786 Beaver Run Trace Unit 1
- 795 Beaver Run Trace
- 794 Beaver Run Trace
- 763 Beaver Run Trace Unit 1
- 770 Beaver Run Trace
- 1322 Sweetwater Ct
- 1322 Sweetwater Ct Unit I
- 923 Sweetwater Way
- 859 Sweetwater Way
- 1001 Mark Trail
- 851 Sweetwater Way
- 762 Beaver Run Trace