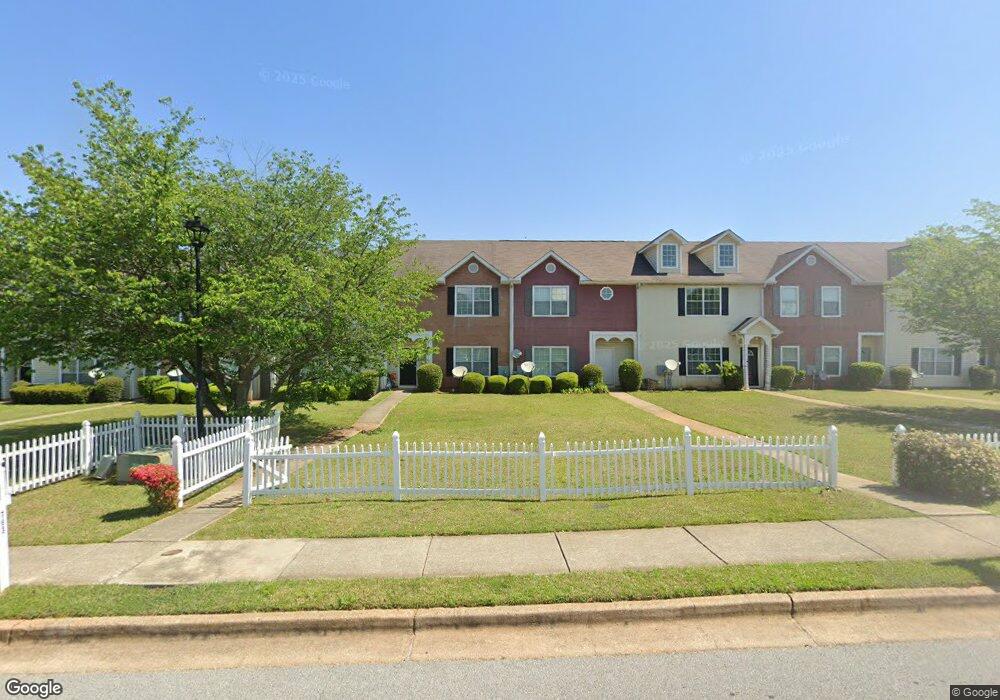
783 Commerce Blvd Riverdale, GA 30296
Estimated Value: $177,000 - $218,000
4
Beds
3
Baths
1,508
Sq Ft
$128/Sq Ft
Est. Value
About This Home
This home is located at 783 Commerce Blvd, Riverdale, GA 30296 and is currently estimated at $192,728, approximately $127 per square foot. 783 Commerce Blvd is a home located in Clayton County with nearby schools including Lake Ridge Elementary School, Kendrick Middle School, and Riverdale High School.
Ownership History
Date
Name
Owned For
Owner Type
Purchase Details
Closed on
Jun 4, 2021
Sold by
Jackson Brenda J
Bought by
Johnson Deonfreya M
Current Estimated Value
Home Financials for this Owner
Home Financials are based on the most recent Mortgage that was taken out on this home.
Original Mortgage
$127,645
Outstanding Balance
$115,567
Interest Rate
2.9%
Mortgage Type
FHA
Estimated Equity
$77,161
Purchase Details
Closed on
Dec 17, 2008
Sold by
Federal Home Loan Mortgage Corporation
Bought by
Jackson Brenda J
Purchase Details
Closed on
Oct 7, 2008
Sold by
Wells Fargo Bank Na
Bought by
Federal Home Loan Mortgage Corporation
Purchase Details
Closed on
Nov 15, 2005
Sold by
Peachtree Homes Inc
Bought by
Kafele Malik H
Home Financials for this Owner
Home Financials are based on the most recent Mortgage that was taken out on this home.
Original Mortgage
$107,445
Interest Rate
6.04%
Mortgage Type
New Conventional
Create a Home Valuation Report for This Property
The Home Valuation Report is an in-depth analysis detailing your home's value as well as a comparison with similar homes in the area
Home Values in the Area
Average Home Value in this Area
Purchase History
| Date | Buyer | Sale Price | Title Company |
|---|---|---|---|
| Johnson Deonfreya M | $130,000 | -- | |
| Jackson Brenda J | -- | -- | |
| Federal Home Loan Mortgage Corporation | -- | -- | |
| Wells Fargo Bank Na | $73,000 | -- | |
| Kafele Malik H | $119,400 | -- |
Source: Public Records
Mortgage History
| Date | Status | Borrower | Loan Amount |
|---|---|---|---|
| Open | Johnson Deonfreya M | $127,645 | |
| Previous Owner | Kafele Malik H | $107,445 |
Source: Public Records
Tax History Compared to Growth
Tax History
| Year | Tax Paid | Tax Assessment Tax Assessment Total Assessment is a certain percentage of the fair market value that is determined by local assessors to be the total taxable value of land and additions on the property. | Land | Improvement |
|---|---|---|---|---|
| 2024 | $3,217 | $81,480 | $7,200 | $74,280 |
| 2023 | $2,530 | $70,080 | $7,200 | $62,880 |
| 2022 | $1,986 | $49,640 | $7,200 | $42,440 |
| 2021 | $1,785 | $44,240 | $7,200 | $37,040 |
| 2020 | $1,540 | $37,566 | $7,200 | $30,366 |
| 2019 | $1,375 | $32,930 | $5,600 | $27,330 |
| 2018 | $1,196 | $28,516 | $5,600 | $22,916 |
| 2017 | $1,080 | $25,616 | $5,600 | $20,016 |
| 2016 | $1,089 | $25,824 | $5,600 | $20,224 |
| 2015 | $1,071 | $0 | $0 | $0 |
| 2014 | $779 | $18,633 | $6,400 | $12,233 |
Source: Public Records
Map
Nearby Homes
- 785 Commerce Blvd
- 828 Commerce Blvd
- 634 Shadowmoore Dr
- 7563 Winderemere Park
- 7740 Briar Forest Ln
- 838 Cormac Dr
- 7617 Lakemoor Dr
- 0 Sugarcreek Way Unit 10572882
- 0 Sugarcreek Way Unit 7622149
- 955 Loch Forest Way
- 510 Olde Rose Ct Unit 1
- 7737 Bar Harbor Dr
- 1124 E Briar Gate Ct
- 7340 Chalk Way
- 462 Paul St
- 7356 Caribou Trail
- 7584 Ann St
- 7280 Fernwood Dr Unit 4
- 7560 Taylor Rd Unit 5
- The Sussex Plan at Crescent Towns
- 781 Commerce Blvd Unit 781
- 781 Commerce Blvd
- 785 Commerce Blvd Unit 785
- 785 Commerce Blvd
- 787 Commerce Blvd
- 779 Commerce Blvd
- 779 Commerce Blvd Unit 779
- 789 Commerce Blvd
- 777 Commerce Blvd
- 791 Commerce Blvd
- 775 Commerce Blvd
- 773 Commerce Blvd
- 795 Commerce Blvd
- 761 Commerce Blvd Unit BLVD
- 761 Commerce Blvd
- 797 Commerce Blvd
- 799 Commerce Blvd
- 759 Commerce Blvd
- 808 Commerce Blvd Unit C
- 808 Commerce Blvd