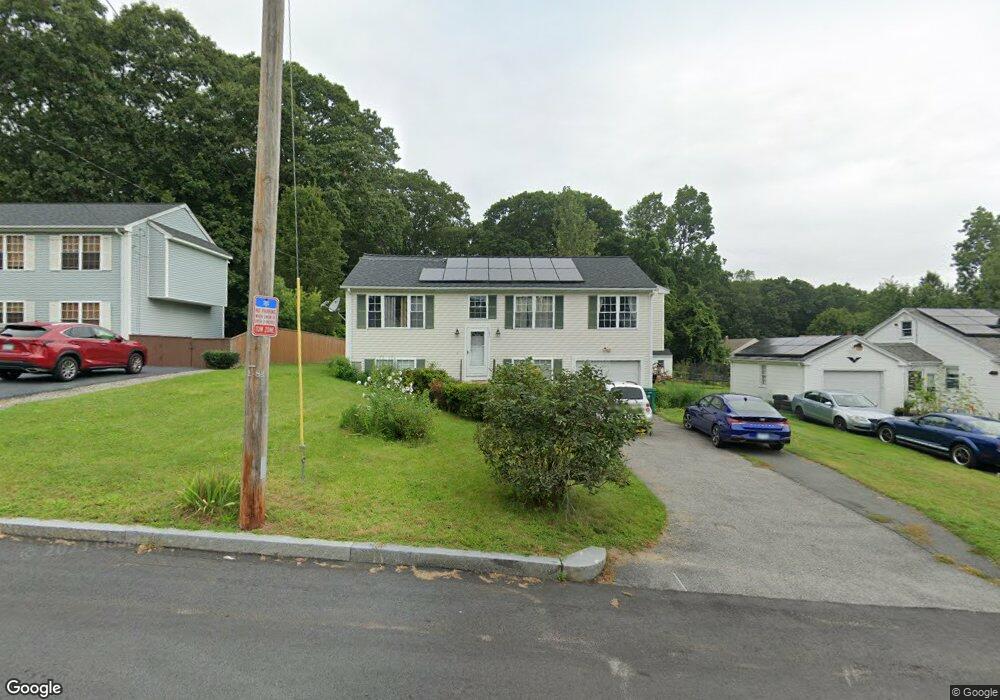
783 Fairmount St Woonsocket, RI 02895
Fairmount NeighborhoodEstimated Value: $384,000 - $393,885
3
Beds
2
Baths
1,040
Sq Ft
$373/Sq Ft
Est. Value
About This Home
This home is located at 783 Fairmount St, Woonsocket, RI 02895 and is currently estimated at $387,471, approximately $372 per square foot. 783 Fairmount St is a home located in Providence County with nearby schools including Woonsocket High School, Rise Prep Mayoral Academy Middle School, and Rise Prep Mayoral Academy.
Ownership History
Date
Name
Owned For
Owner Type
Purchase Details
Closed on
Apr 16, 2024
Sold by
Ledoux Albert H
Bought by
Ledoux Ft and Ledoux
Current Estimated Value
Purchase Details
Closed on
May 12, 2003
Sold by
Superior Properties In
Bought by
Ledoux Albert H
Home Financials for this Owner
Home Financials are based on the most recent Mortgage that was taken out on this home.
Original Mortgage
$127,900
Interest Rate
5.93%
Mortgage Type
Purchase Money Mortgage
Create a Home Valuation Report for This Property
The Home Valuation Report is an in-depth analysis detailing your home's value as well as a comparison with similar homes in the area
Home Values in the Area
Average Home Value in this Area
Purchase History
| Date | Buyer | Sale Price | Title Company |
|---|---|---|---|
| Ledoux Ft | -- | None Available | |
| Ledoux Ft | -- | None Available | |
| Ledoux Albert H | $160,000 | -- | |
| Ledoux Albert H | $160,000 | -- |
Source: Public Records
Mortgage History
| Date | Status | Borrower | Loan Amount |
|---|---|---|---|
| Previous Owner | Ledoux Albert H | $25,000 | |
| Previous Owner | Ledoux Albert H | $127,900 |
Source: Public Records
Tax History Compared to Growth
Tax History
| Year | Tax Paid | Tax Assessment Tax Assessment Total Assessment is a certain percentage of the fair market value that is determined by local assessors to be the total taxable value of land and additions on the property. | Land | Improvement |
|---|---|---|---|---|
| 2025 | $3,782 | $336,800 | $90,500 | $246,300 |
| 2024 | $4,048 | $278,400 | $92,200 | $186,200 |
| 2023 | $3,892 | $278,400 | $92,200 | $186,200 |
| 2022 | $3,892 | $278,400 | $92,200 | $186,200 |
| 2021 | $4,662 | $196,300 | $59,700 | $136,600 |
| 2020 | $4,711 | $196,300 | $59,700 | $136,600 |
| 2018 | $4,727 | $196,300 | $59,700 | $136,600 |
| 2017 | $4,322 | $143,600 | $46,600 | $97,000 |
| 2016 | $4,572 | $143,600 | $46,600 | $97,000 |
| 2015 | $5,253 | $143,600 | $46,600 | $97,000 |
| 2014 | $3,590 | $142,700 | $51,300 | $91,400 |
Source: Public Records
Map
Nearby Homes
- 724 Fairmount St
- 235 6th Ave
- 517 Fairmount St
- 290 3rd Ave
- 123 4th Ave
- 168 3rd Ave
- 394 3rd Ave
- 227 3rd Ave
- 336 Olo St
- 4 Sharon Pkwy
- 5 Lincoln Dr
- 356 S Main St
- 595 S Main St
- 190 Coe St
- 74 Highland St
- 29 Graves Ave
- 420 River St
- 34 Smithfield Rd
- 0 River & Transit St Unit 1392331
- 0 River & Transit St Unit 73430058