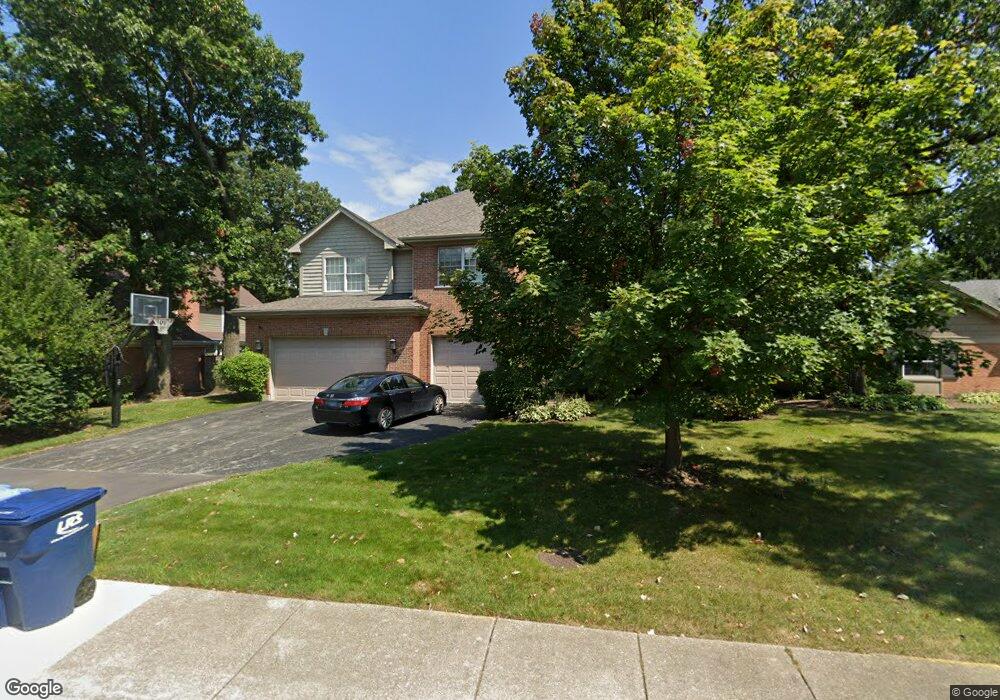
783 Fox Hunt Trail Deerfield, IL 60015
Briarwood NeighborhoodEstimated Value: $926,000 - $1,330,000
4
Beds
4
Baths
3,999
Sq Ft
$288/Sq Ft
Est. Value
About This Home
This home is located at 783 Fox Hunt Trail, Deerfield, IL 60015 and is currently estimated at $1,151,518, approximately $287 per square foot. 783 Fox Hunt Trail is a home located in Lake County with nearby schools including Kipling Elementary School, Alan B Shepard Middle School, and Deerfield High School.
Ownership History
Date
Name
Owned For
Owner Type
Purchase Details
Closed on
Nov 1, 2002
Sold by
Greenview Group Of Ill Llc
Bought by
Gottlieb Beth M and Gottlieb Brian M
Current Estimated Value
Home Financials for this Owner
Home Financials are based on the most recent Mortgage that was taken out on this home.
Original Mortgage
$475,000
Outstanding Balance
$191,330
Interest Rate
5.5%
Estimated Equity
$960,188
Purchase Details
Closed on
Oct 31, 2001
Sold by
Glassman Jordan
Bought by
Greenview Group Of Illinois Inc
Home Financials for this Owner
Home Financials are based on the most recent Mortgage that was taken out on this home.
Original Mortgage
$1,240,750
Interest Rate
5%
Purchase Details
Closed on
Jul 1, 1996
Sold by
Rose Christopher J and Rose Gwen
Bought by
Glassman Jordan
Create a Home Valuation Report for This Property
The Home Valuation Report is an in-depth analysis detailing your home's value as well as a comparison with similar homes in the area
Home Values in the Area
Average Home Value in this Area
Purchase History
| Date | Buyer | Sale Price | Title Company |
|---|---|---|---|
| Gottlieb Beth M | $821,500 | Chicago Title Insurance Co | |
| Greenview Group Of Illinois Inc | $321,000 | -- | |
| Glassman Jordan | $225,000 | Chicago Title Insurance Co |
Source: Public Records
Mortgage History
| Date | Status | Borrower | Loan Amount |
|---|---|---|---|
| Open | Gottlieb Beth M | $475,000 | |
| Previous Owner | Greenview Group Of Illinois Inc | $1,240,750 | |
| Closed | Gottlieb Beth M | $175,000 |
Source: Public Records
Tax History Compared to Growth
Tax History
| Year | Tax Paid | Tax Assessment Tax Assessment Total Assessment is a certain percentage of the fair market value that is determined by local assessors to be the total taxable value of land and additions on the property. | Land | Improvement |
|---|---|---|---|---|
| 2024 | $25,886 | $314,484 | $56,000 | $258,484 |
| 2023 | $26,950 | $283,472 | $50,478 | $232,994 |
| 2022 | $26,950 | $290,213 | $55,453 | $234,760 |
| 2021 | $25,545 | $280,535 | $53,604 | $226,931 |
| 2020 | $24,487 | $280,535 | $53,604 | $226,931 |
| 2019 | $23,855 | $279,222 | $53,353 | $225,869 |
| 2018 | $24,665 | $300,893 | $58,417 | $242,476 |
| 2017 | $24,432 | $299,158 | $58,080 | $241,078 |
| 2016 | $23,524 | $284,804 | $55,293 | $229,511 |
| 2015 | $22,765 | $264,614 | $51,373 | $213,241 |
| 2014 | $22,165 | $251,908 | $61,643 | $190,265 |
| 2012 | $21,511 | $253,378 | $62,003 | $191,375 |
Source: Public Records
Map
Nearby Homes
- 850 Evergreen Way
- 810 Virginia Rd
- 805 Brand Ln
- 717 Brierhill Rd
- 1075 Heather Rd
- 1816 Rosemary Rd
- 666 Barberry Rd
- 1039 Deerfield Place Unit 1039
- 1490 Avignon Ct
- 513 Sumac Rd
- 757 Kipling Place
- 95 Greenbriar Dr E
- 860 Kenton Rd
- 1381 Sunnyside Ave
- 505 Margate Terrace
- 1127 Kenton Rd
- 1263 Carlisle Place
- 75 Eastwood Dr
- 49 Larkdale Rd
- 1672 Huntington Ln
- 777 Fox Hunt Trail
- 795 Fox Hunt Trail
- 780 Smoke Tree Rd
- 790 Smoke Tree Rd
- 760 Smoke Tree Rd
- 807 Fox Hunt Trail
- 763 Fox Hunt Trail
- 784 Fox Hunt Trail
- 776 Fox Hunt Trail
- 800 Fox Hunt Trail
- 814 Smoke Tree Rd
- 750 Smoke Tree Rd
- 819 Fox Hunt Trail
- 810 Fox Hunt Trail
- 762 Fox Hunt Trail
- 826 Smoke Tree Rd
- 740 Smoke Tree Rd
- 781 Shag Bark Ln
- 795 Shag Bark Ln
- 775 Smoke Tree Rd